
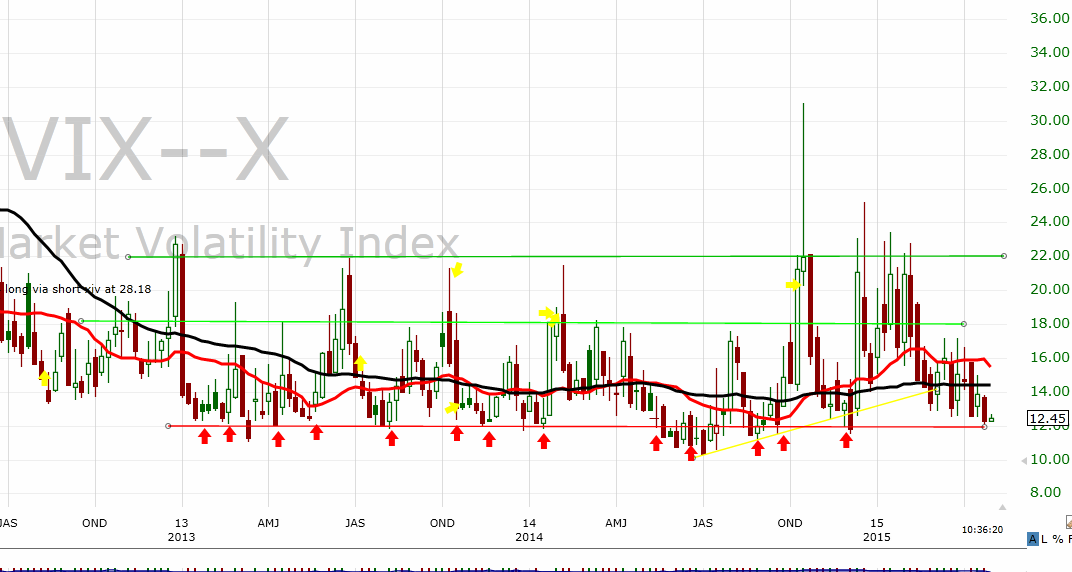
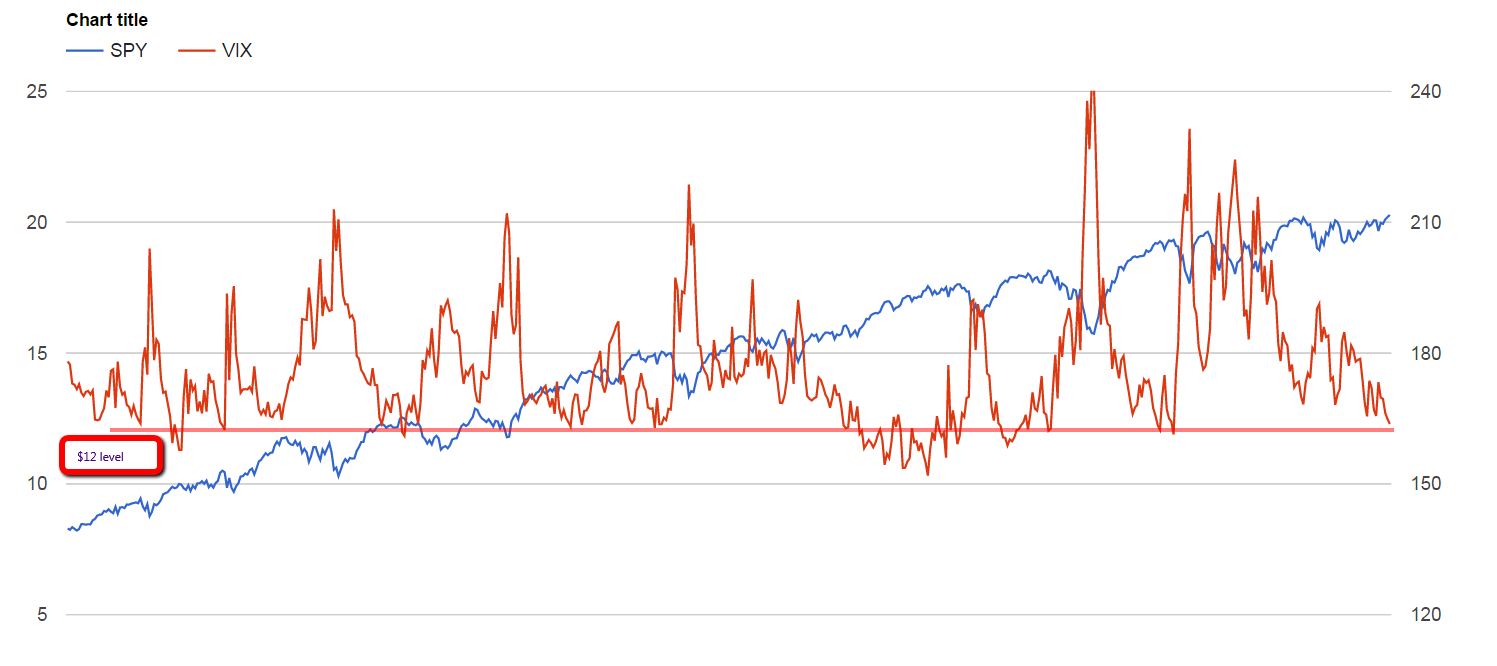
Many market participants say that you can’t chart the VIX, they have valid reasons and justifications that I won’t get into. However, since January 2013 every time the VIX got the $12 dollar level it has bounced, there is no denying that as you can see from the chart below. The purpose of technical analysis is not predict the future, it gives you a road map on what to expect based on what has happened in the past.
If one believes this is actionable the question becomes; how and with what instrument can we take advantage of this. Historically the VIX moves opposite of the market, the market goes up (SPY) the VIX usually goes down and vice versa. If one is a short term trader one can possibly take advantage of this by shorting the SPY or perhaps going long the SPXU (3X SP500 bear etf).
Another option which I believe is the better option is shorting the XIV, as you can see from the chart below the XIV has ran into trouble every time the VIX traded around $12


Leave A Comment