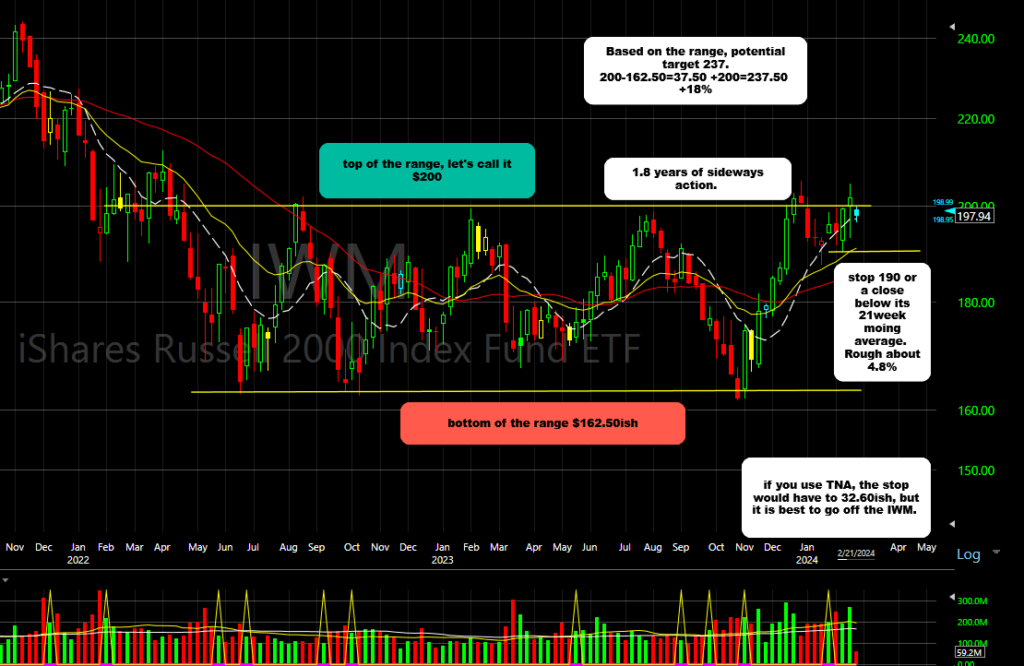
$IWM has been stuck in a range for 1.8 years.

• Top of the range, call it $200. The bottom of the range–162.50ish.

• If you believe in targets, take the top of the range minus the bottom of the range and add that to the top of the range; $200-$162.50 = $37.50 + +200 = $237.50.

• STOP: on the weekly chart, the $190 level looks like the proper initial sell stop. From current levels, that is about 4% away. The potential upside based on the stock range is about +19.9%.

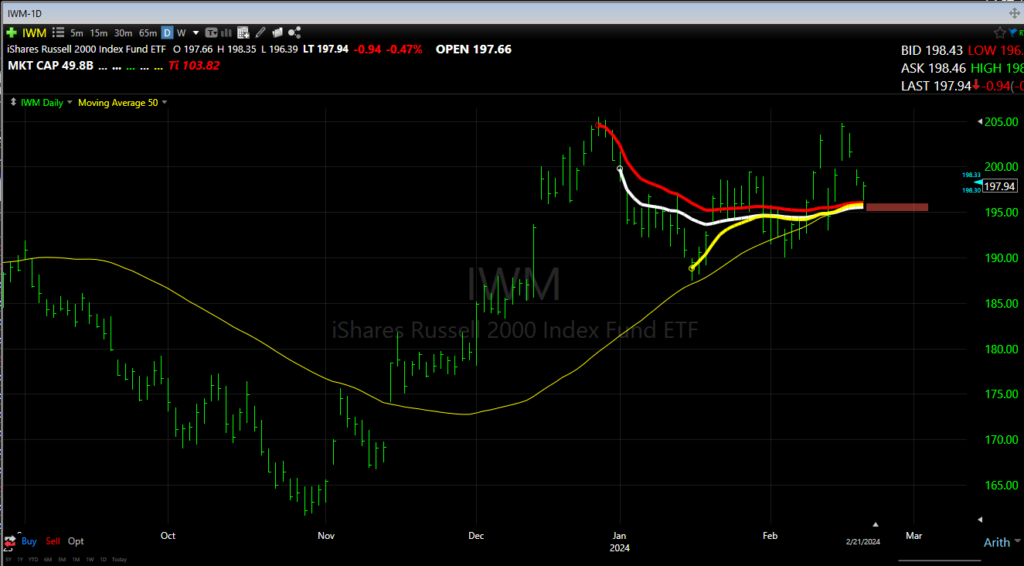
• On the daily chart, there is a more aggressive signal. (The trigger is above yesterday’s high with a stop at yesterday’s low of 196.30ish).

•The $IWM has pulled back three days in a row, and it’s sitting right above its 50-day moving average, its year-to-date Anchored VWAP, 12/27/23 high VWAP, and year-to-date low VWAP.

• And there’s always the $TNA for the more aggressive.

Managed Assets.

Subscribe To Our Trade Ideas


This information is issued solely for informational and educational purposes and does not constitute an offer to sell or a solicitation of an offer to buy securities. None of the information contained in this blog constitutes a recommendation that any particular security, portfolio of securities, transaction, or investment strategy is suitable for any specific person. From time to time, the content creator or its affiliates may hold positions or other interests in securities mentioned in this blog. The stocks presented are not to be considered a recommendation to buy any stock. This material does not take into account your particular investment objectives. Investors should consult their own financial or investment adviser before trading or acting upon any information provided. Past performance is not indicative of future results.