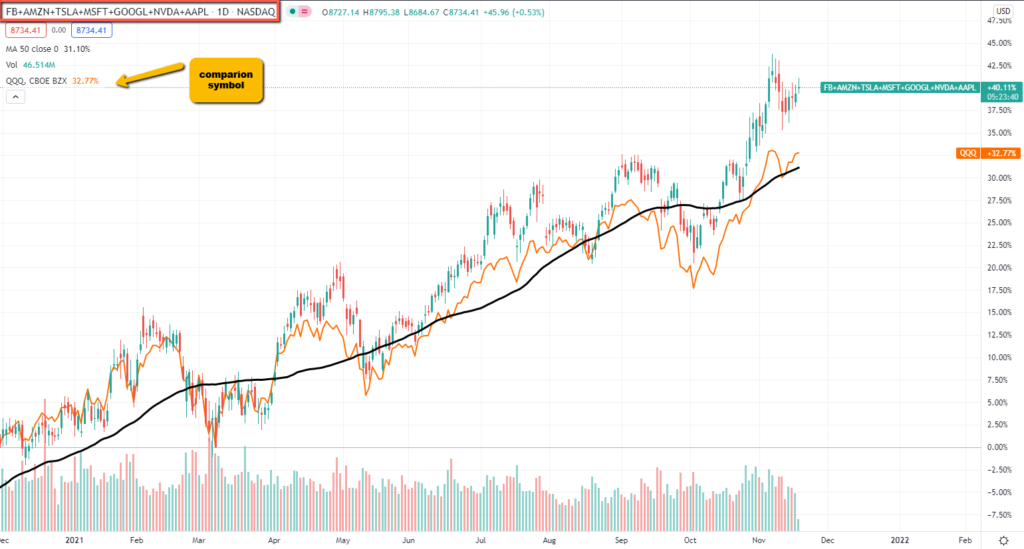
Microsoft, Apple, Amazon, Tesla, Alphabet (Google), Facebook, and Nvidia now account for 26.4% of the S&P500 and a whopping 50.7% of the $QQQ.
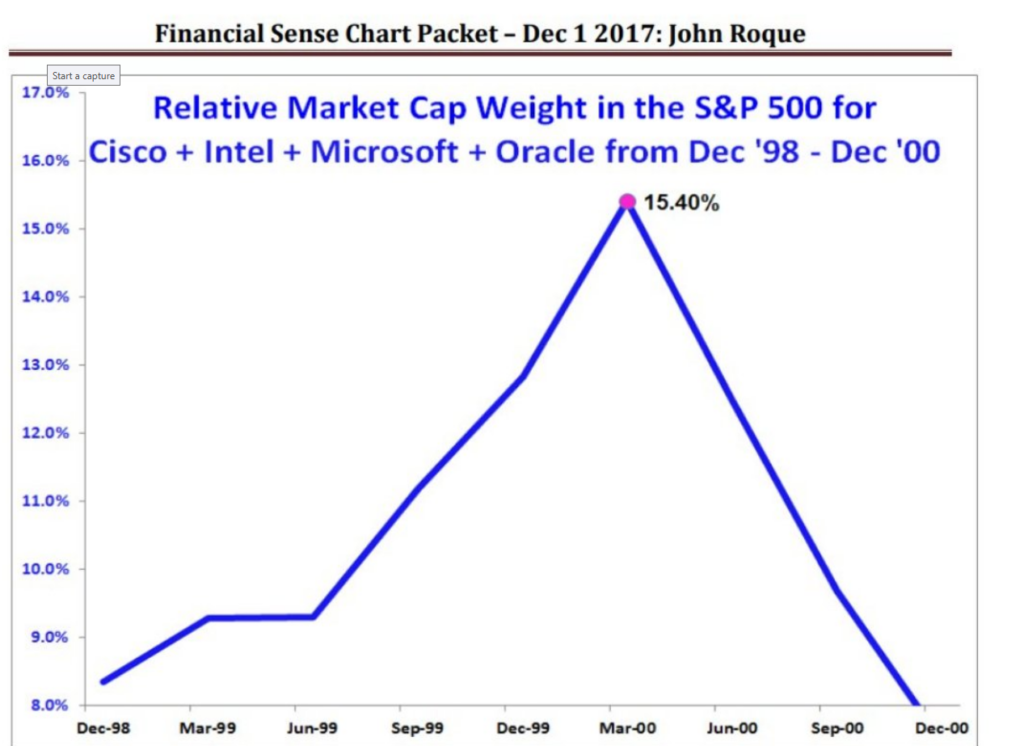
To put that in perspective, at the height of the internet bubble, the four horsemen of that time were; CISCO, INTEL, MICROSOFT, and ORACLE.
At their peak, they accounted for 15.40% of the S&P 500.
Now that you know this, it is easy to see how the market of stocks peaked in February, yet the indices continued their march higher without a hiccup.
The FAATMAN’s masked what was going on with most stocks underneath the surface for most of the year; they were struggling.
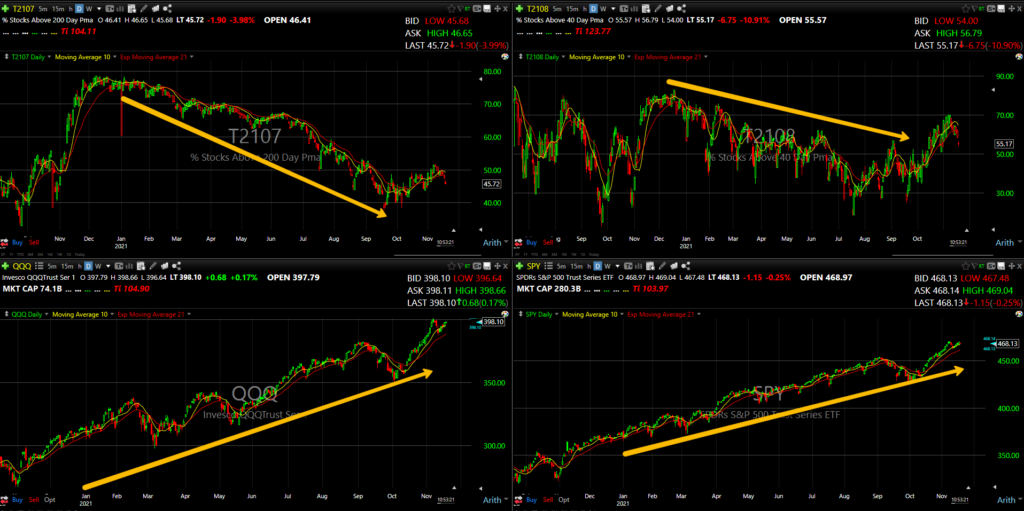
Check out these four charts; you have stocks above their 40-day moving average, stocks above their 200-day moving average, and you have the S&P 500 and the Nasdaq 100. You will notice that breadth (most stocks) trending down for a big part of the year versus the indices trending higher, thanks to FAATMAN.
Before you start comparing the four horsemen of 1999 that led to a market peak to today’s 7-horsemen, understand that negative divergence is a condition, NOT a SIGNAL.
The stocks in the S&P 500 and the Nasdaq 100 are weighted by market capitalization.
You literally cannot short the SPY or the QQQ for longer than a cup of coffee unless these stocks break down.
History says they probably will, but you don’t want to anticipate this; you are better off reacting.
Stay connected;
You can find Stocks Before They Breakout Here and here
You can view over 400 of my trades here https://www.tradervue.com/shared/users/8059.