
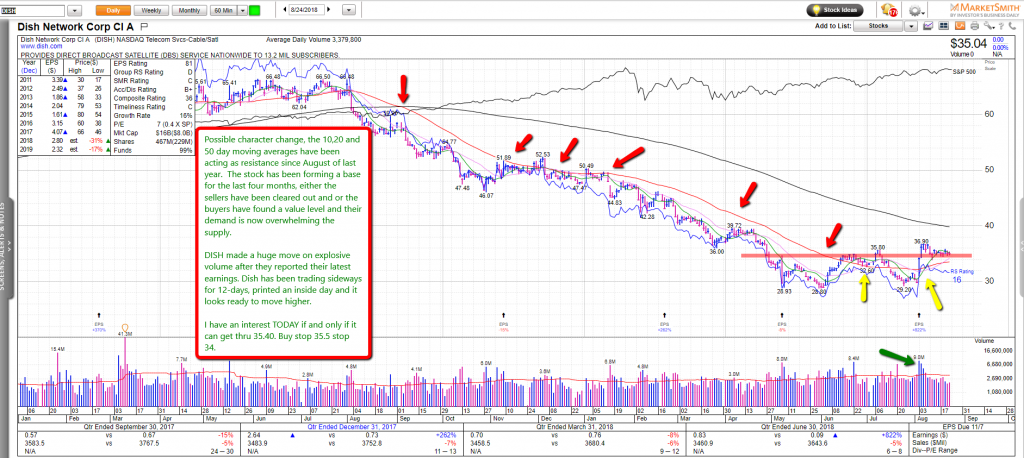
Dish Network $DISH is going through a possible character change; the stock was in a serious downtrend for 9-months as you can see on the chart below. $DISH peaked on 8/1/2017 at $65 a share and finally found a low 50% lower at around $30, within that timeframe the 10, 20, and 50-day moving averages acted as resistance. Sellers were very active when $DISH moved up to those averages. The stock has since found a level where it seems that the sellers have been cleared out and or buyers have found a level of interest in which their demand is overwhelming the supply.
TRADE IDEA; buy stop 35.50 stop $34. #IBDPartner Chart by MarketSmith
Try MarketSmith
Frank Zorrilla, Registered Advisor In New York. If you need a second opinion, suggestions, and or feedback in regards to the market feel free to reach me at fzorrilla@zorcapital.com or 646-480-7463.
See How I Translate My Tweets & Blogs Into Actual 3rd Party Verified Trades


Leave A Comment