
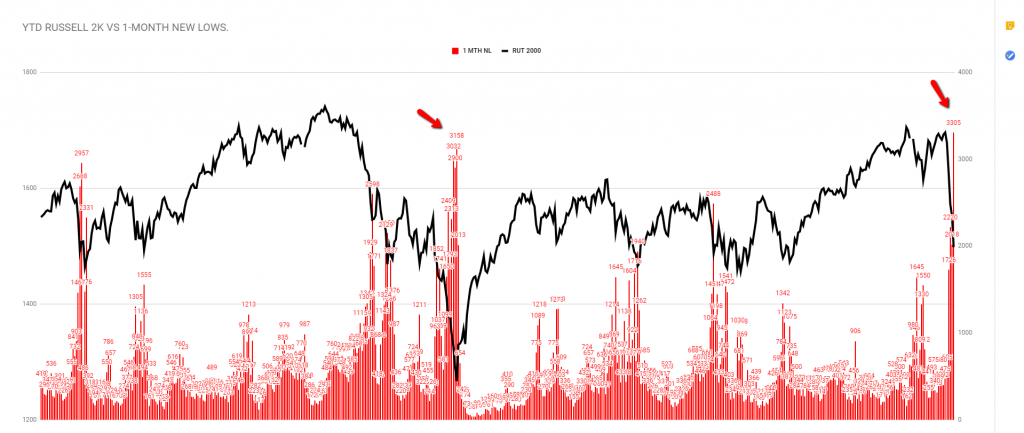
What a sell-off, the financial media said that this was the worst week since the great financial crisis, the S&P 500 was down -11.4%, at lows of Friday is was down as much as -14%. Underneath the surface, breadth was as bad as it was back in December 2018 when the S&P 500 was down -20%.
But before we jump into the data here are a few things we should know;
“The psychology of the investing public changes—cycling from the most blissed-out euphoria abut equities to the most abject terror and then back again, always at the wrong times.”
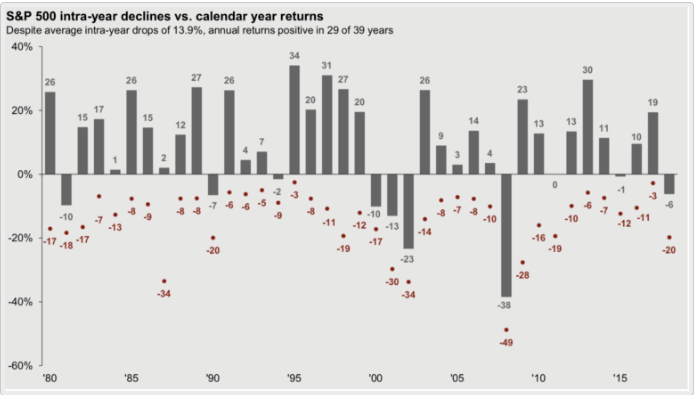
Almost every year, we get a decent size decline; in fact, over the last 30-years, the average intra-year decline in the S&P 500 has been roughly -14%. These common sell-offs always happen for different reasons. The media makes them out to be more than they are, emotions take over, and people sell indiscriminately—same beat different drums. As of tonight, the S&P 500 is down 12.6% in the last six days, this sell-off my stop at the intra-year average -14% or it might be more like 2018 when the S&P 500 lost -20%. The point is that no one ever made any money panicking. My advice is always the same, be vigilant with your stocks, they come and go, take your stops, and live to fight another day. Be more patient with your index holdings, especially if time is on your side, and perhaps take advantage of sell-off by nibbling when we down to the average intra-year decline levels of -14%.
Here are all the breadth data that I posted on Twitter on Thursday.
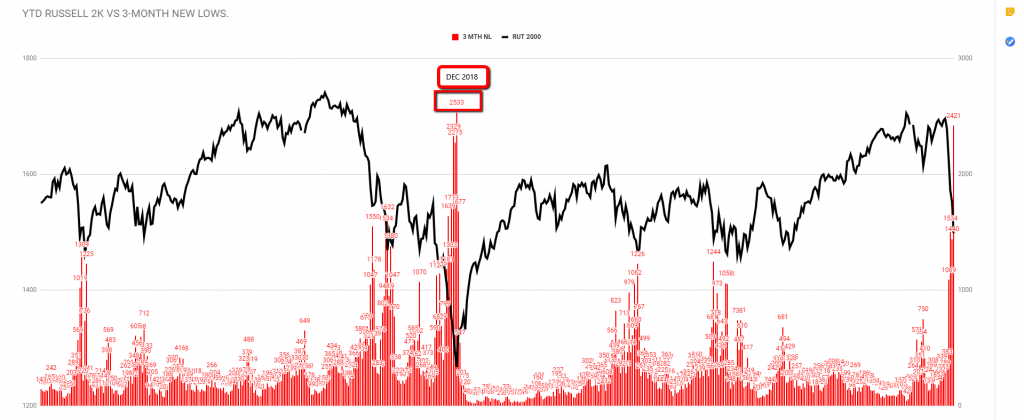
3,305 New fresh on month lows, this amount is higher than all the readings from December 2018.
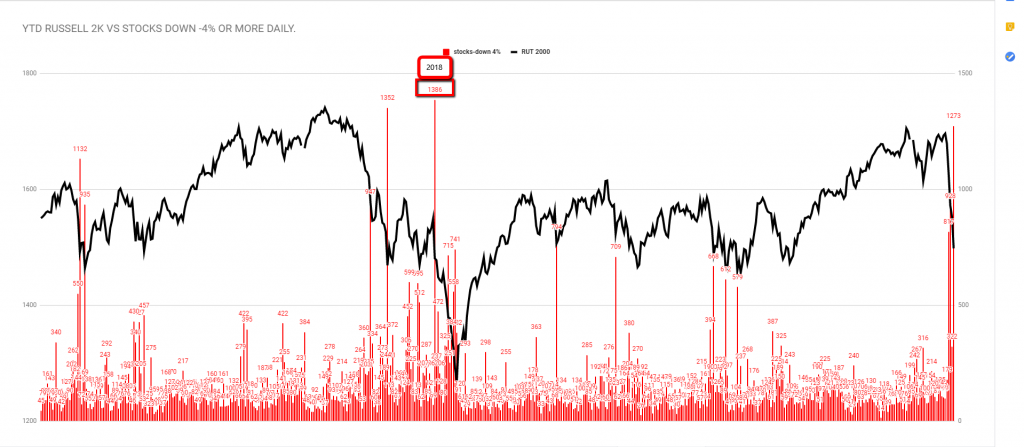
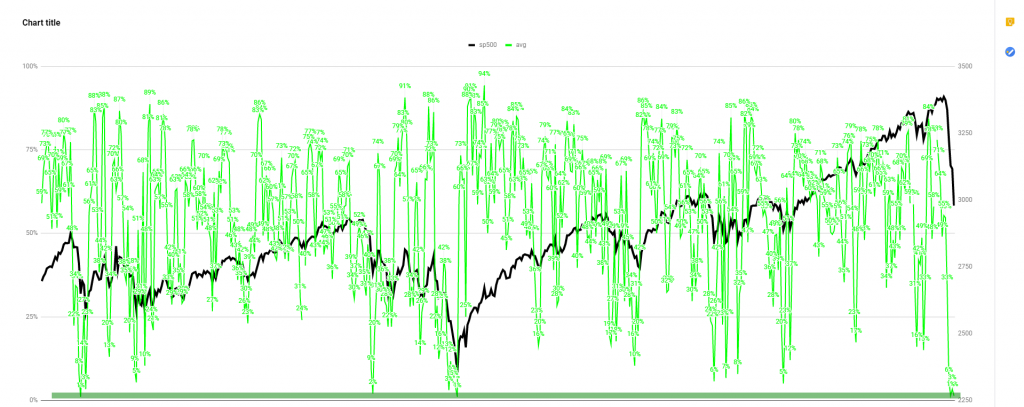
1,273 U.S stocks were down -4% or more yesterday, if you include all stocks (ADR’S) that number goes up to 1,426.
2,421 STOCks printed fresh 3-month lows
% of S&P 500 Stocks above their 3,5,10 day moving averages=1%
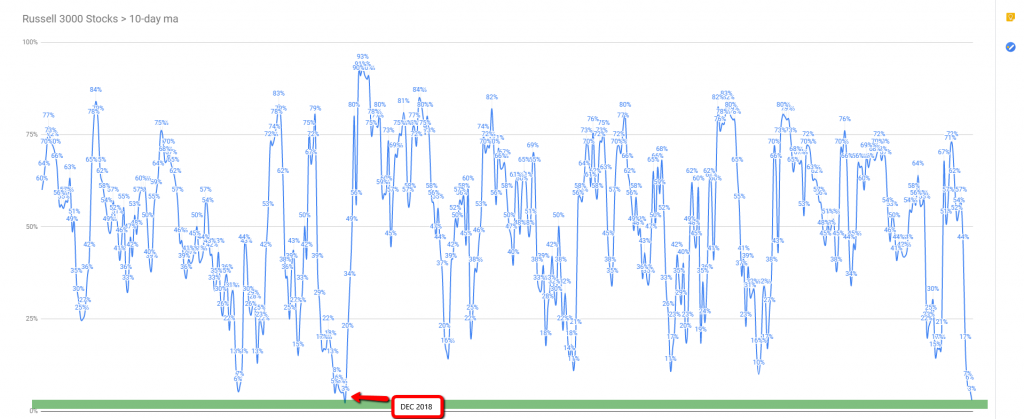
3% OF Russell 3k stocks are above their 10-day moving average.
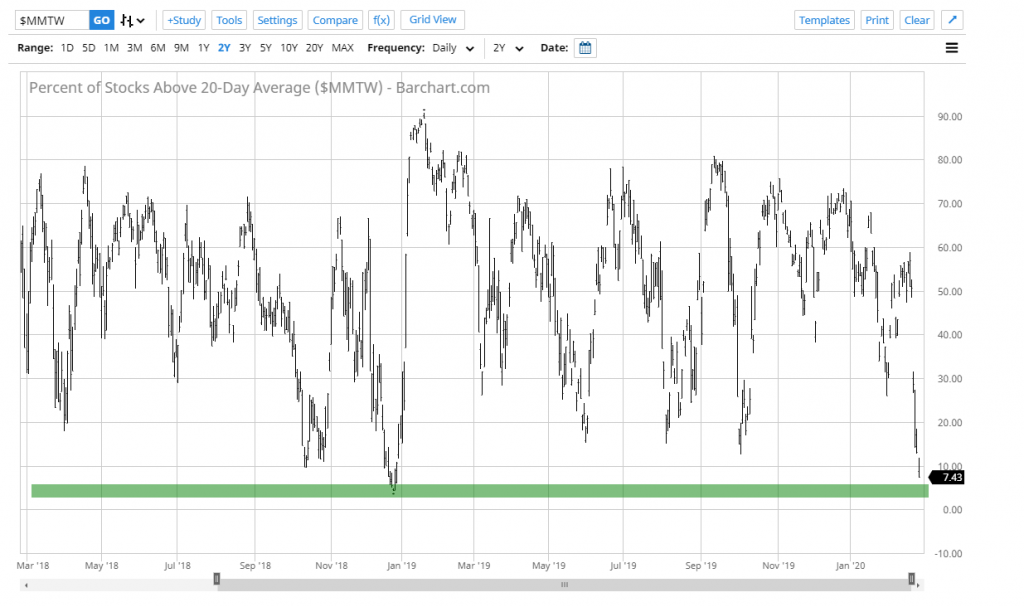
7.43% of all stocks are above their 20-day average.
The above readings are at extreme oversold levels; a short-term bounce is not out of the question because markets go up and down, not up or down. My personal feeling is that this will be a -20% correction.
Here are previous posts similar to this one from past corrections;
frankzorrilla.com/the-pain-train/
frankzorrilla.com/near-washout-b
frankzorrilla.com/more-extreme-r
frankzorrilla.com/sp500-field-gu
frankzorrilla.com/when-it-all-fa
You can find stocks before the breakout here (managed assets) or DIY
You can view over 100 shared trades here


Leave A Comment