Not one person on financial twitter did not know that last week historically has been the weakest week for last 30 years.
From @QuantifiableEdges; “As I have shown many times in the past, there isn’t a more reliable time of the year to have a selloff than this upcoming week. I have often referred to is as “The Weakest Week.” Since 1960 the week following the 3rd Friday in September has produced the most bearish results of any week”.

For the week the S&P 500 lost -1.0%, the Nasdaq shed -2.2%, and the Russell 2000 was down -2.4%, there’s no doubt that the impeachment news and the constant back and forth with the Chinese government helped the cause. The homegamer at home only watching the indices is probably saying to himself that last week’s losses were no big deal, which is true. However, most people own more than just the S&P 500; they also own individual common stocks. And there is where some real damage is, especially in the growth names and recent IPO’s.
Here’s what I mean; FFTY (IBD 50 ETF GROWTH NAMES) down -11% since peaking in the middle of July, the S&P 500 is only down -.60% since then, the Nasdaq 100 -2%, and the Russell 2000 (small caps) are only down -1.73% since FFTY peaked on 7/19/19.
Growth name ROKU is down -43% in the last 14 days; SHOP is down -25% in 22 days, CRWD is down -47% in the previous 27 days, ZS -47%, $AYX -28%, OKTA -30%, and the list goes on. Whether or not this carnage will spill over to the rest of the market remains to be seen.
IPO (Renaissance IPO ETF) is down -16.82% since it’s 7/29 high. The Renaissance IPO ETF gives you exposure to the most significant newly public U.S. listed companies.

So what’s next? No one knows, but here is the Dow Jones Pre-Election Years seasonal chart going back 116 years. The chart represents a guideline, not an actual map of how things will work out between now and the end of the year.

What we do know is that the day to day action of the market is all noise. The noise is hyperbole and sensationalized by the media and financial twitter. The financial news outlets need viewers and blogs need clicks, it’s a business, so every up and downtick is rationalized, explained, and given meaning like it means something, but it doesn’t. However, if you are looking for a reason, any reason, you will find it.
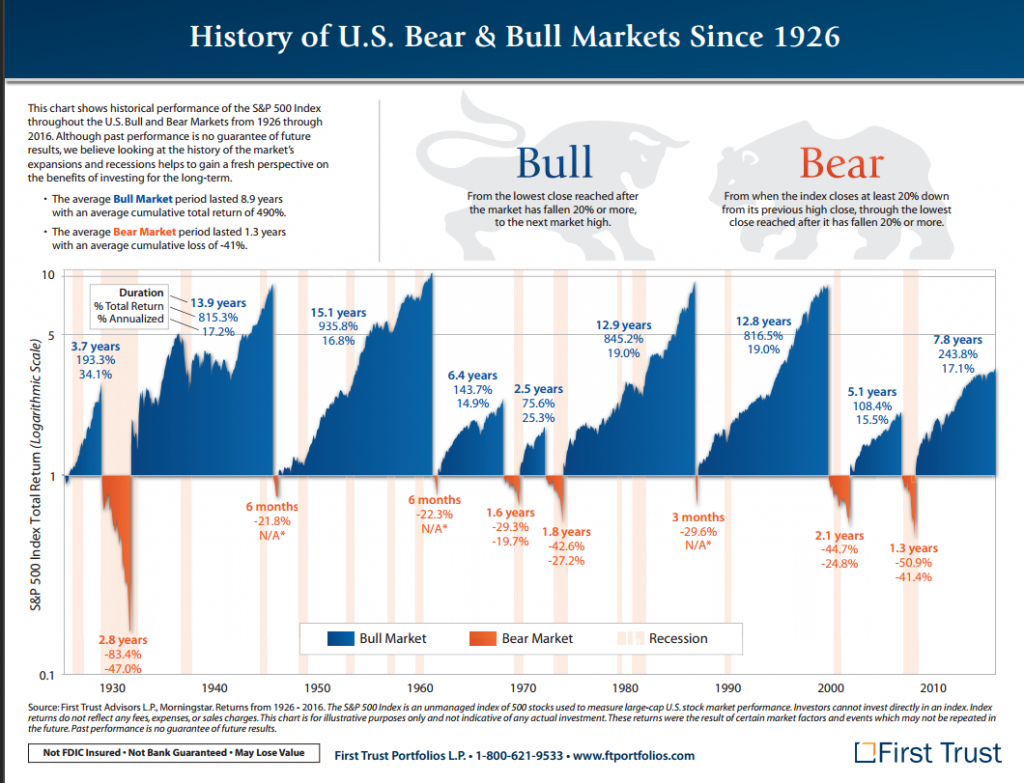
What you should remember is that the market, as in the S&P 500 (not individual stocks) tends to move higher over time regardless of what is happening around the world. Time is the keyword, the more you have, the better off you will be, see the chart below.

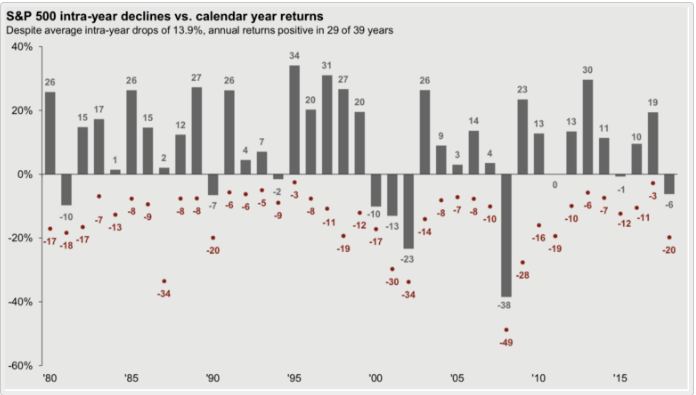
They are no free lunches. Even the best bull markets have pullbacks along the way, in fact, the average drawdown in the S&P 500 in the last 39 years has been -14%. If you remember last year, the market pulled back -20% in the last 3-months. Despite those intra-year pullbacks the S&P 500 has closed higher 29 out of 39 of those calendar years. So when the pullback finally arrives understand and accept that it’s part of the game, pullbacks are unavoidable, and you can’t enjoy the upside without taking some heat.

When you study the two previous charts (intra-year decline & history of bull/bear market) it is not hard to see what the right thing to do is when you get down to the average intra-year drawdown levels, it starts with a B and ends with a Y.
“And heaven knows, the psychology of the investing public changes–cycling from the most blissed-out euphoria about equities to the most abject terror and then back again, always at the wrong times’.-Nick Murray
You can find Stocks Before They Breakout Here https://bit.ly/2Cuh784 and Here https://bit.ly/2JZ3JNR
This information is issued solely for informational and educational purposes and does not constitute an offer to sell or a solicitation of an offer to buy securities. None of the information contained in this blog constitutes a recommendation that any particular security, portfolio of securities, transaction, or investment strategy is suitable for any specific person. From time to time, the content creator or its affiliates may hold positions or other interests in securities mentioned in this blog. The stocks presented are not to be considered a recommendation to buy any stock. This material does not take into account your particular investment objectives. Investors should consult their own financial or investment adviser before trading or acting upon any information provided. Past performance is not indicative of future results.

Leave A Comment