Most of the time and for most investors, we get tied down to thinking that we know what the market is doing just by looking at how the DOW JONES or SP500 closed on the day. Occasionally that is all you need to know, but for the majority of the time, it only tells you half the story.

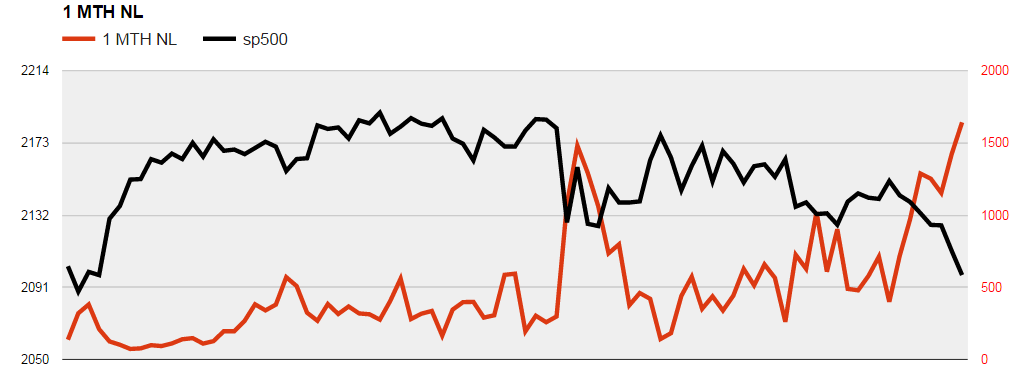
Since July the SP500 has done nothing but trade sideways, the closing price on 7/1 was 2,102.95, the closing price yesterday was 2,097.94. However, underneath the surface, we have seen some real carnage on individual stocks. The Dow Jones is comprised of 30 stocks; that doesn’t tell you anything about what is going on unless all you own is the Dow Jones. The SP500 is comprised of 500 stocks, the top 5 having just as much influence on the index as the bottom 250 combined. In other words, the top 5 stocks can make the index look better or worse than what is actually going on depending on what the top 5-10 stocks are doing.

In the meantime, let’s take a look at breadth charts below to get a better feel of the environment (starting 7/1).

SP500 versus 1-month lows
SP500 versus 3-month lows
Here are the stats; the SP500 closed at 2,102.95 on 7/1/2016, it closed at 2,097.94 yesterday, a difference of 5-points.  On 7/1/2016 we had 137 1-month new lows and 69 3-month lows, fast forward to yesterday and those numbers stand at 1,642 new 1-month lows and 976 3-month lows in individual stocks, all while the SP500 is only down net 5 points.
The good thing is that spikes in these breadth ratios tend to lead to short-term bottoms (1-5 days).
Frank Zorrilla, Registered Advisor In New York. If you need a second opinion, suggestions, and or feedback in regards to the market feel free to reach me at fzorrilla@zorcapital.com or 646-480-7463. 
This information is issued solely for informational and educational purposes and does not constitute an offer to sell or a solicitation of an offer to buy securities. None of the information contained in this blog constitutes a recommendation that any particular security, portfolio of securities, transaction, or investment strategy is suitable for any specific person. From time to time, the content creator or its affiliates may hold positions or other interests in securities mentioned in this blog. The stocks presented are not to be considered a recommendation to buy any stock. This material does not take into account your particular investment objectives. Investors should consult their own financial or investment adviser before trading or acting upon any information provided. Past performance is not indicative of future results.