
According to Investors Business Daily, the high tight flag pattern is a very rare pattern that can be very profitable. Here is there definition; High, tight flag bases clearly make this statement: “We’re up-and-coming.” This vertical-looking pattern forms as a stock surges 100% to 120% in four to eight weeks. The stock then corrects just 10% to 25% in price for only three to five weeks. The ideal buy point is the high of the flag plus 10 cents.
Here the link to the full article.
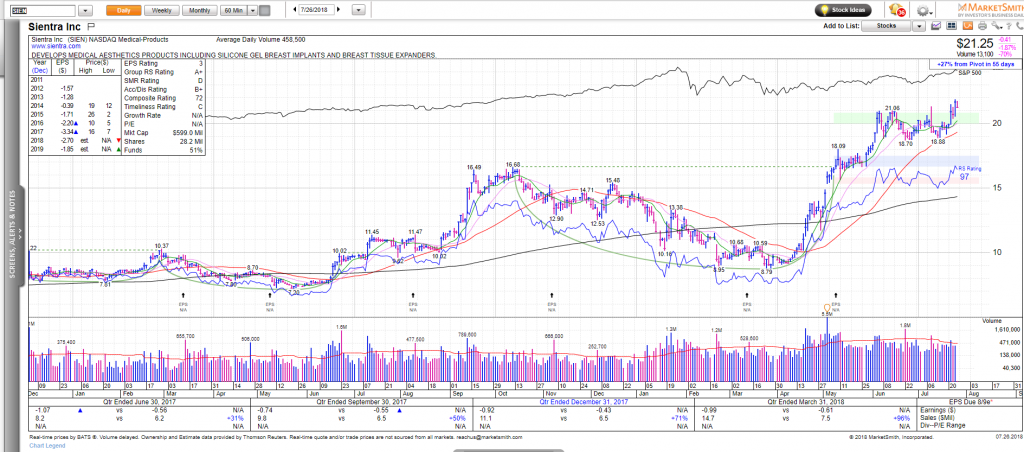
Sientra Inc $SIEN fits the description to the t. Is $SIEN up 100% to 120% in four to eight weeks–yes. Has the stock corrected less than 25%-yes. Did the stock pass the ideal buy point-yes. #IBDPartner

Frank Zorrilla, Registered Advisor In New York. If you need a second opinion, suggestions, and or feedback in regards to the market feel free to reach me at fzorrilla@zorcapital.com or 646-480-7463.
See How I Translate My Tweets & Blogs Into Actual 3rd Party Verified Trades


Leave A Comment