
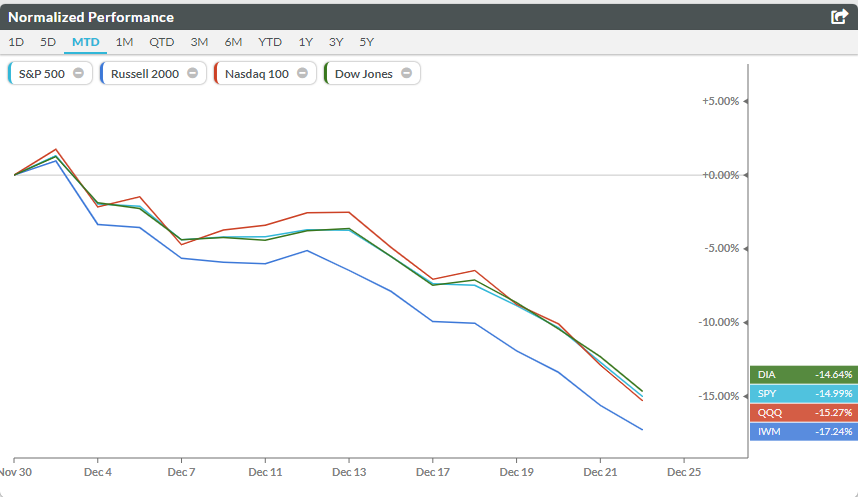
The pain train for the bulls started in October, and it has accelerated this month. Month to date the S&P500 is down -14.99%, the Dow Jones is down -14.64%, the Nasdaq 100 is down -15.27, and the small caps are leading the pack, they are down -17.24% this month so far.
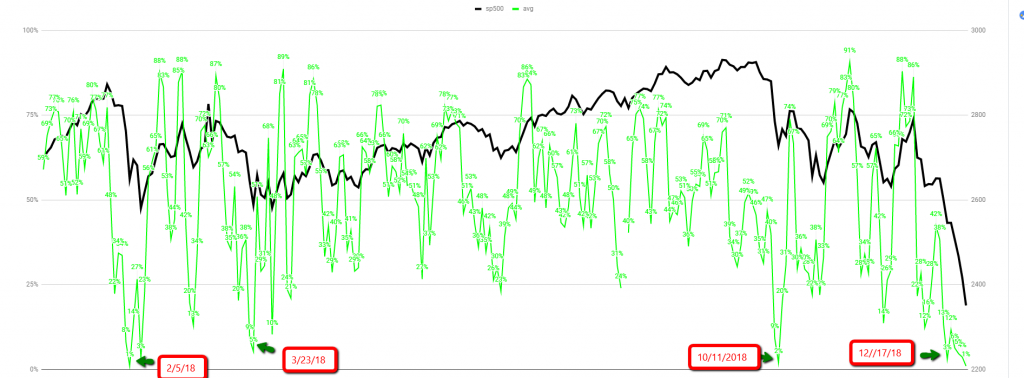
As of right now, there’s only one stock in the S&P500 above its 10-day moving average, as of matter of fact the index is the most oversold its been all year. These type of oversold levels have led to relief bounces in the past, so far this month oversold levels have only led to more oversold levels. The chart below shows you the average amount of S&P-500 stocks above their 3, 5, and, 10-day moving averages, that reading today is at 1%.
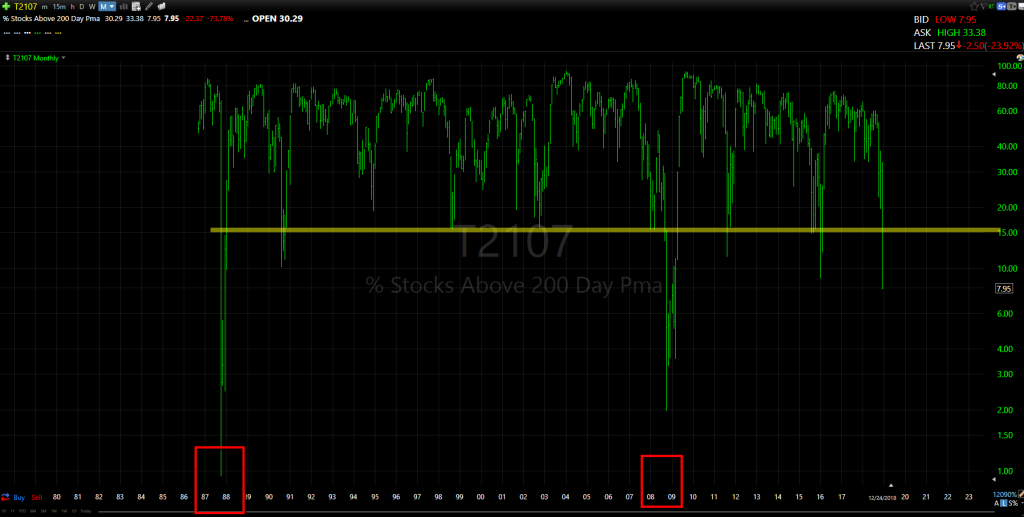
The percent of stocks trading above their 200-day moving average is more of a longer-term indicator; this is also at very oversold levels (7.95%), levels not seen since the Great Financial Crisis and 1987, this shows you the magnitude of the sell-off so far.
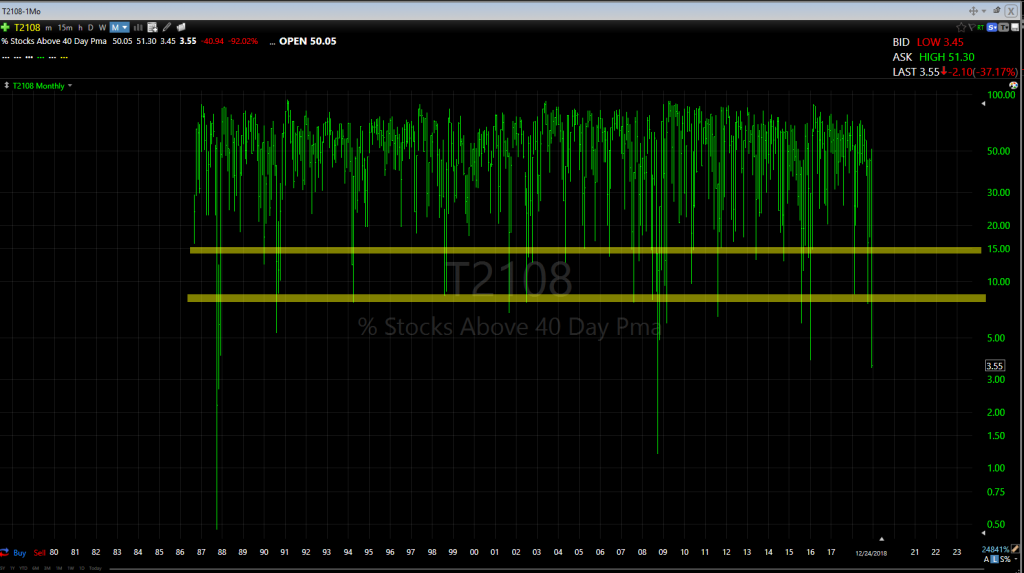
Stocks above their 40-day moving average, an intermediate breadth indicator is also at levels rarely seen, 3% of stocks are above their 40-day moving average, you can see on the chart below how rare this reading is.
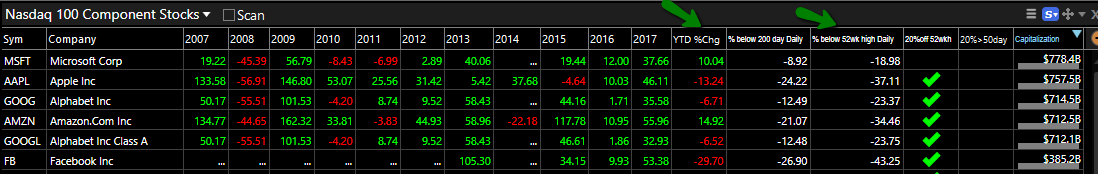
The “Leading Stocks” have not been spared, once considered untouchables, $FB, $AMZN, $NFLX, $MSFT, $GOOGL, as a group is down 29% since their peak on 8/29/18.
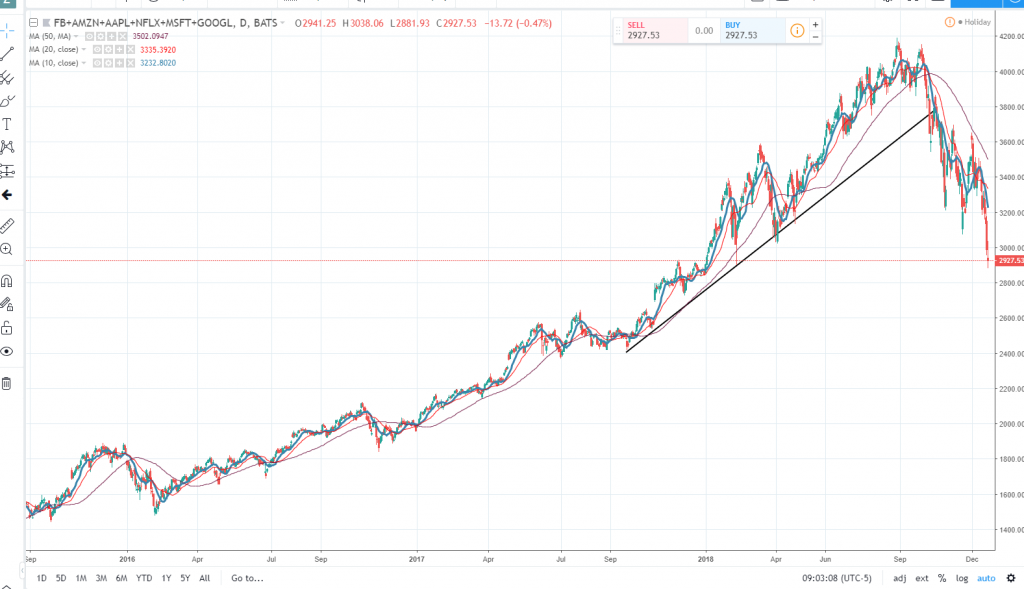
Individually from their 52-week high; $NFLX -44.74%, $FB -43.25%, $AAPL -37.11%, $AMZN -34.46%, $MSFT -18.98%.
In the $QQQ there is only one stock that is up this month; $NTES +7.91%. 12 Stocks are down 20% or more this month, $AMZN -20.48%, $NVDA -22.24% are the big ones.

In the Dow Jones two stocks are down 20% or more; Walgreens and American Express, twelve are down between -15% and -19.99%.

In the S&P-500, ninety-three Stocks are down -20% or more, with $PRGO leading the pack at -41.39%. 417 of the 505 S&P-500 stocks are down 10% or more this month.

The small caps have been hit the hardest, in the Russell 2000, seven-hundred and fifty names are down -20% or more, that’s 37% of the index.

Sector-wise the Energy sector has been hit the hardest, -29.48% below its 52 week-high, followed by Basic Materials -24.66%.

Out of 146 industries, only Silver and Gold are up this month.

The sell-off has spared no one, the Oracle of Omaha Warren Buffett portfolio has taken a big hit. Based on his reported holdings last quarter, his top holdings have taken a hit to the tune of roughly 37 billion dollars. Unlike many, he is probably not panicking and more than likely he’s putting some of that $100-billion in cash he has to work, we will know soon enough. You can read about that HERE.
- Apple (AAPL) – roughly $19 billion
- Bank of America (BAC) – roughly $5 billion
- American Express (AXP) – a bit over $2 billion
- Kraft Heinz (KHC) – a bit under $3 billion
- U.S. Bancorp (USB) – a bit over a half billion
- Wells Fargo (WFC)- about $4 billion
When you look at the chart of the S&p500 or the Russell 2000 they don’t give you any confidence at all; they are free falling. However, if you flipped the charts, they have that parabolic look of something that is probably too late to own.
Here’s the Russell 2000;

Here the Russell 2000 flipped around, does it look like something you want to buy today?

Every sell-off has the same look, straight down, no bounces, huge volume, comparisons to 1929, 1987, and 2008, while all these are possibilities, they are without a doubt low, very low probability events.
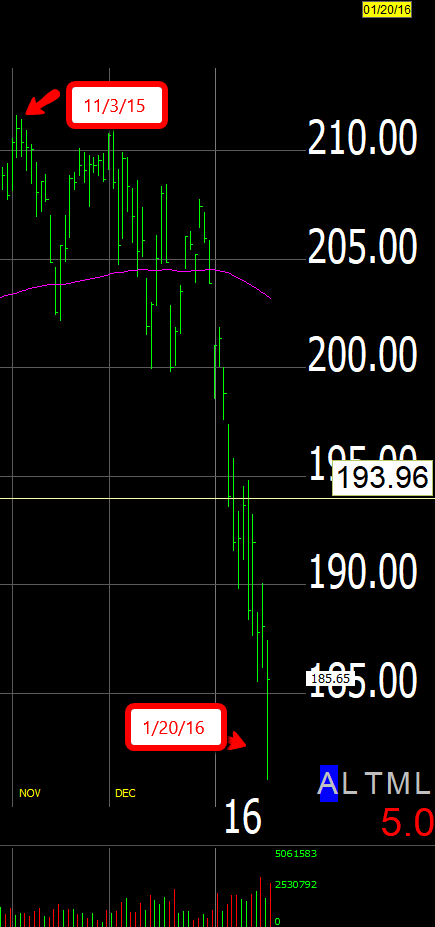
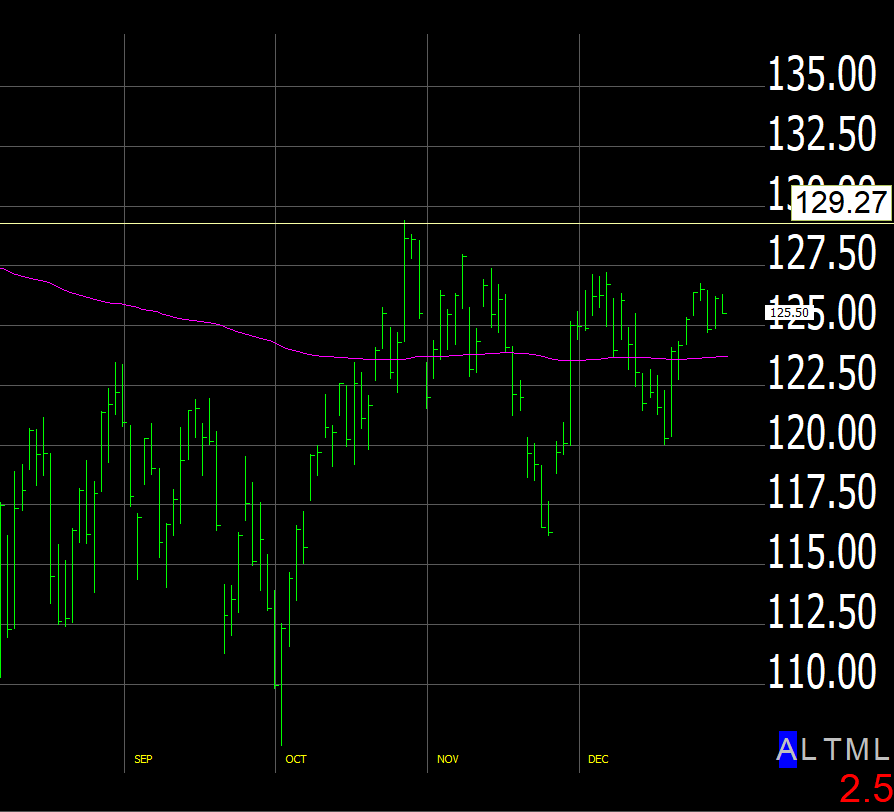
At the end of 2015 and the beginning of 2016 we had a decent size sell-off, the S&P500 was down about -15% in less than two months, here’s how it looked in real-time;
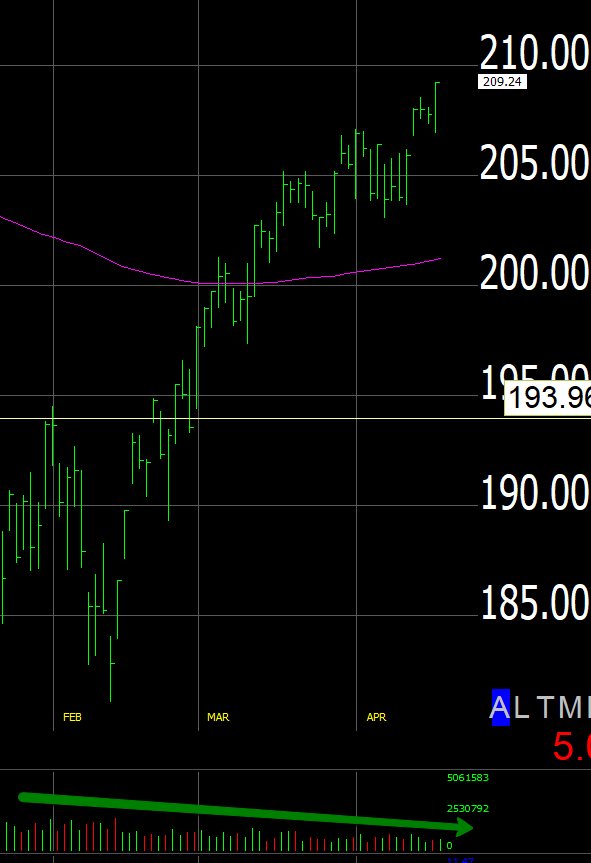
Here you can see how it looked from 1/21/16 on, back then we also had the 1929, 1987, 2008 comparisons.
2011 was a brutal time for the bulls during the summer/fall season, just like now, the market dropped a bunch in a short period, and just like today, we had the 1929, 1987, 2008 comparisons.

Here’s what happened from 8/9/2011 on;
The point is that the market goes up and down not up or down. The chances are high that there is going to better opportunity to sell and to sell short than one that we have today. Chances are also high that we are going to see a decent relief bounce like the ones that we have seen before after these type of sell-offs, one that can be taken advantage of. We saw relief bounces even during the 2008 financial crisis, in case you forgot. Here is a great chart by @AlphaTrends. We had 8-bounces that were 10% or greater.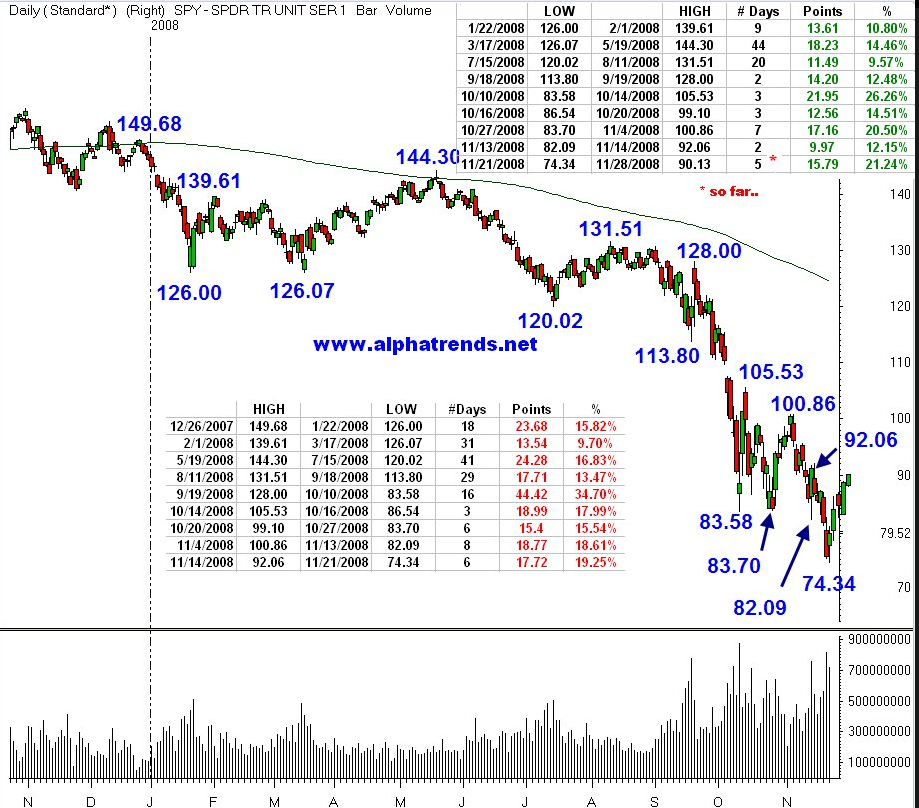
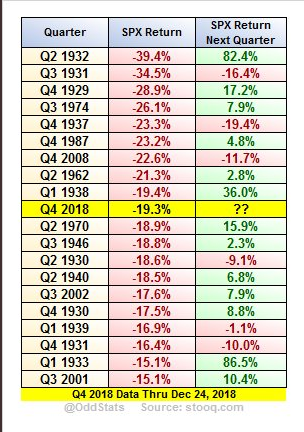
This quarter is shaping up to be one of the worst in history since the inception of the index in 1923 according to @OddStats, you can see below the returns for the next quarter.
In this post HERE I cover other extreme readings that we have today and also what usually happens before every 30-50% correction, just in case the current one turns out to be a big one.


Leave A Comment