
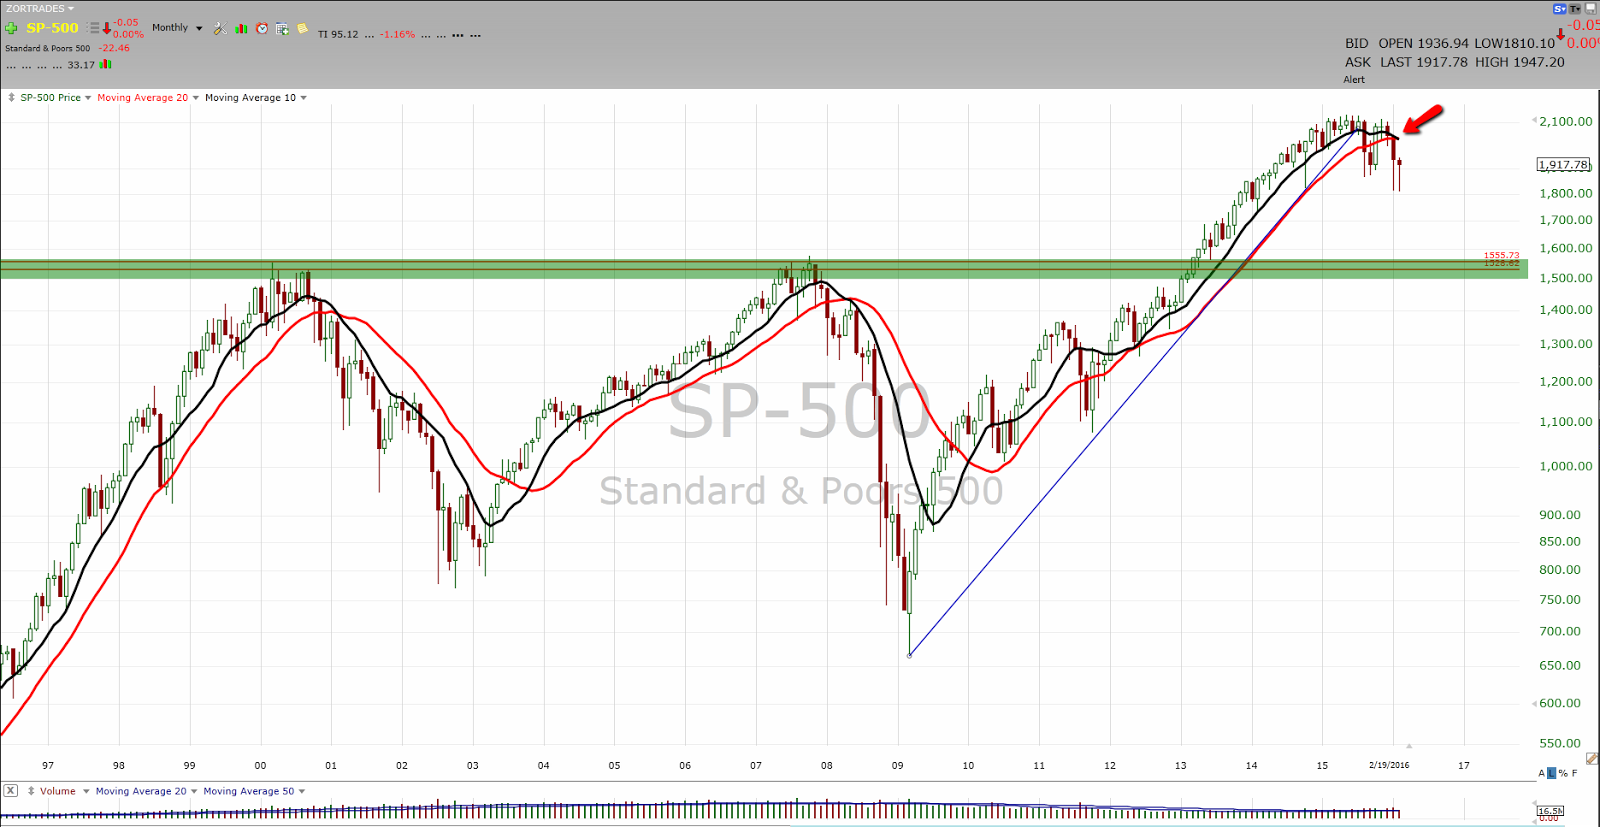
The most widely accepted and general definition of a bull market is if it’s trading above the 10-month moving average (200-day ma). If below then it is considered a bear market. Currently, the SP500 has closed two consecutive months below its 10-month moving average, and unless it can gain +5% in the next five trading days, this will be the third monthly close below it. The more monthly closes below the 10-month moving average, the more likely that the SP500 will retest its 2000-2008 breakout at around 1550 (green line) that would put the SP500 down 24% for the year. The market is about probabilities, not predictions; I believe there is a 40% chance we might get down to the 1550 level.
Using the 10-month moving average as a timing tool has been very effective and profitable over the years as you can see in the charts below. Not only has it saved many an enormous amount of capital, but it has also kept many mentally sane by keeping them out brutal bear markets like 2008. Protecting your mental capital is key, it will allow you to participate fully in the next bull phase without any baggage.

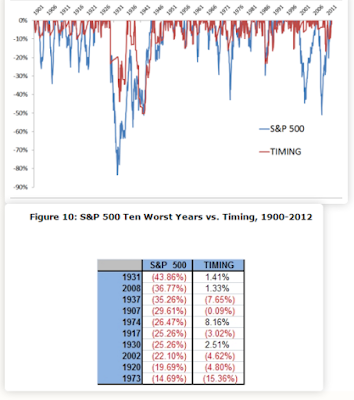


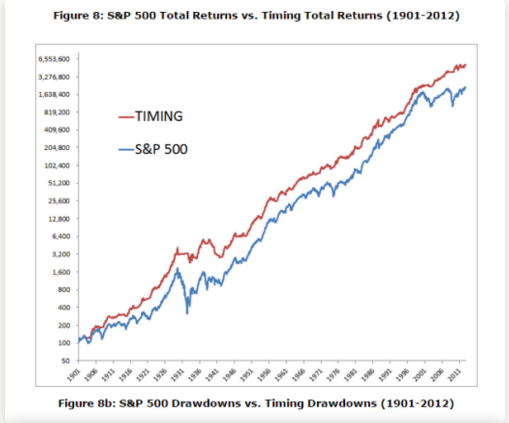
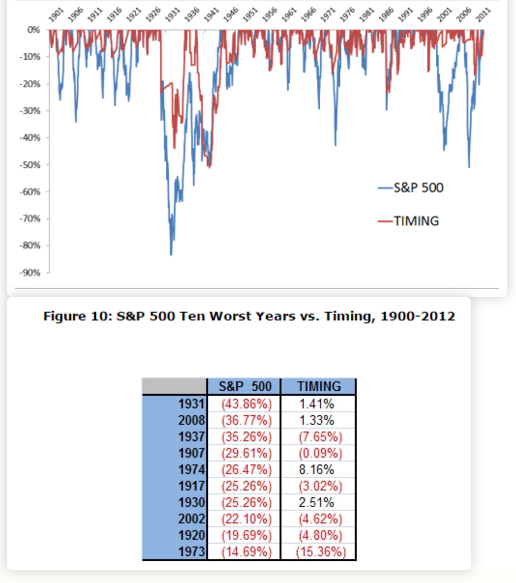
Charts by Meb Faber
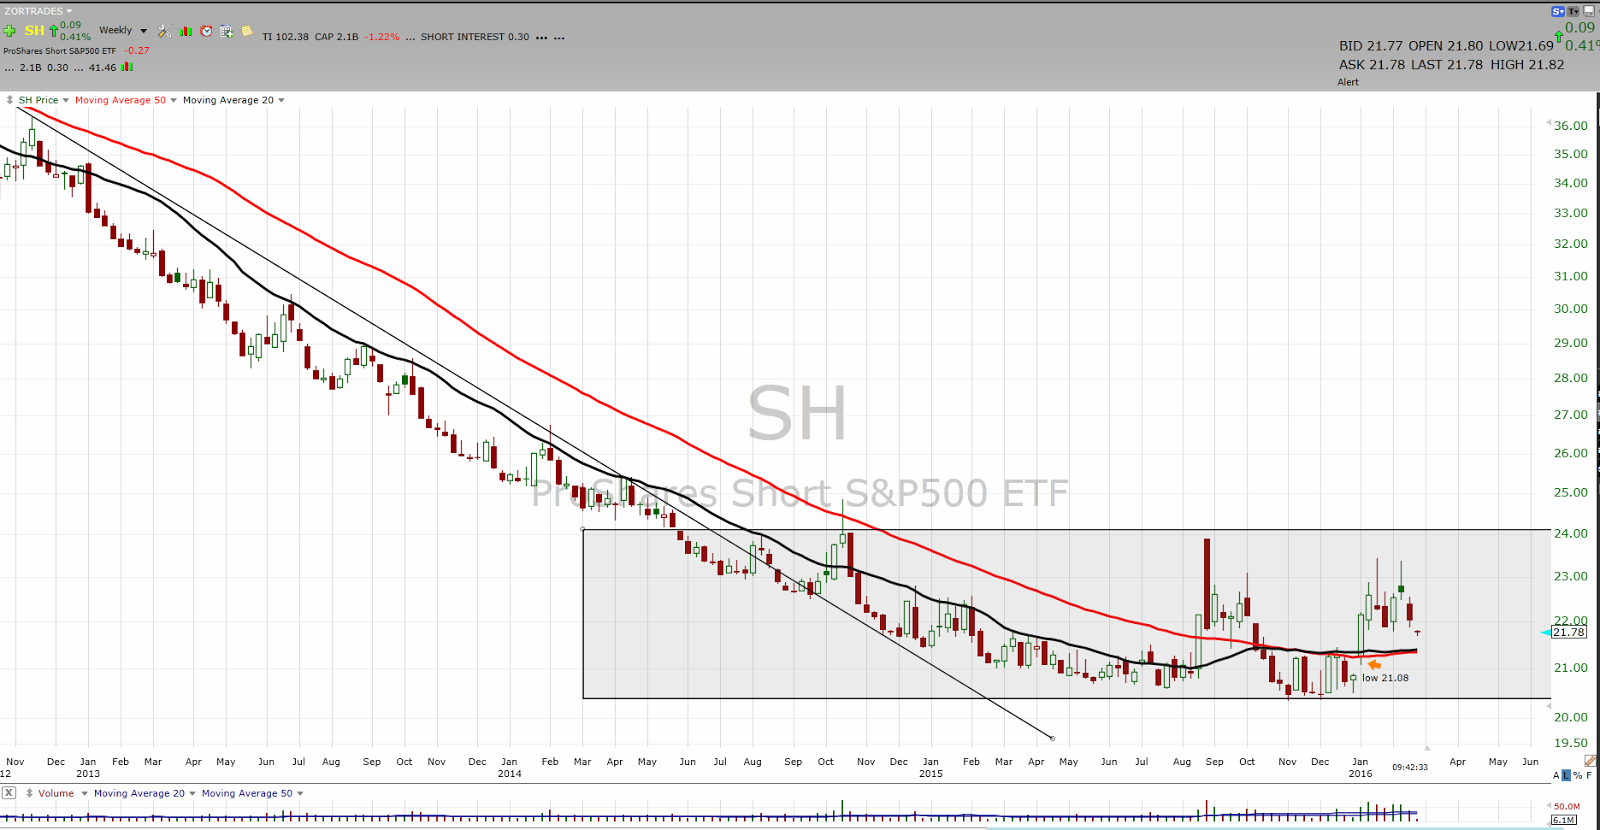
When the SP500 is below its 10-month (200-day) moving average it makes sense to keep a portion of your portfolio in cash until we close back above it on a monthly basis. For those who have an interest in perhaps taking advantage of big decline might consider owning SH;
ProShares Short S&P500 seeks daily investment results, before fees and expenses, that correspond to the inverse (-1x) of the daily performance of the S&P 500®.
If you look at the SH weekly chart, you can easily see that it was in a downtrend for a very long time, and now it has found a floor that looks like a launching pad. Basically, SH is the opposite of the SPY. If you turn the SPY chart upside down, you will see the same thing. Turning the chart upside down gives you a better view/idea of the potential move it can have.

Zooming in the SH chart, one can stay constructive and perhaps consider it as an investment as long as the SP500 stays below its 10-month (200-day) moving average. I would not consider going long SH after the market has had multiple down days; I would rather consider going long SH after the SP500 has ripped higher.
The market tends to be a little more volatile on the way up and on the way down when it is trading below its 200-day moving average. Over the last 30 days, the SP500 gained +6%, lost +6%, and gained +6%. In this environment, you don’t want to chase moves to the upside nor downside.
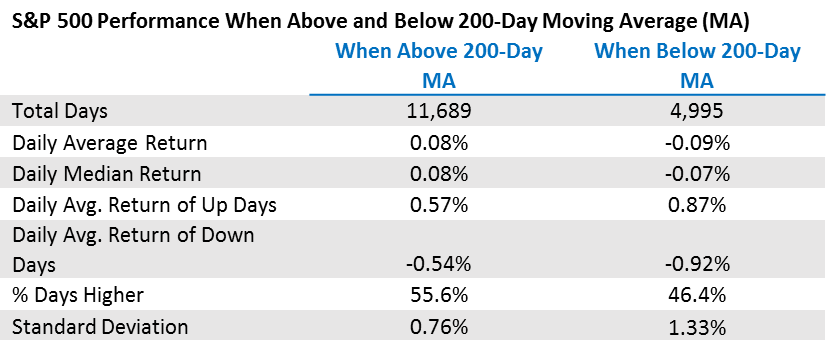
Source; LPL +Ryan Detrick
Bottom line; as long as we are below the 200-day moving average tactical investing makes more sense than passive.
Frank Zorrilla, Registered Advisor In New York. If you need a second opinion, suggestions, and or feedback in regards to the market feel free to reach me at fzorrilla@zorcapital.com or 646-480-7463.


Leave A Comment