
Over the weekend quite a few people pointed out some of the negative divergences that they are seeing. As usual those who point them out are perceived to be short the market, under invested, perma bear, etc….This might be the case or may not be the case, you never know with twitter, but divergences are divergences and what you do with the information is more important.
I’m in the camp that 99% of negative divergences in a bull market should be ignored and or be left to those who are nimble in the short term. For the rest (majority) one should continue to wear the rose colored glasses until the music stops.
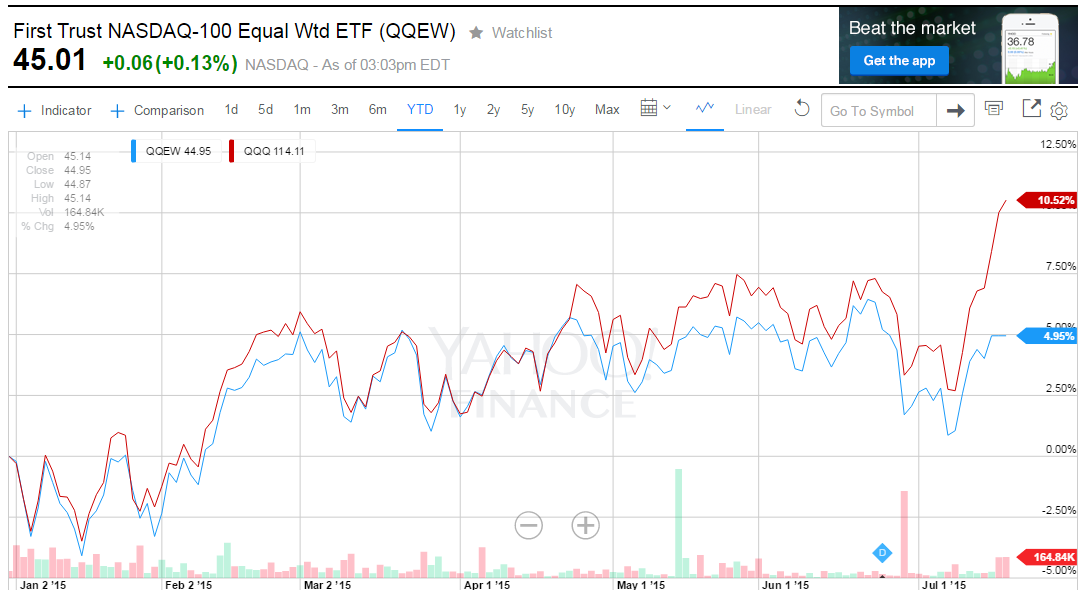
The chart underneath is the QQEW (equal weight to all stocks nasdaq 100 stocks) versus QQQ which gives a higher weight to AAPL (15.41%), MSFT (7.19%), GOOG (3.57%), AMZN (3.48%), FB (3.46%). We all know that Apple, Google, Facebook, and Amazon had tremendous moves in the last 5 days and that in itself explains the huge spread that has taken place between the QQEW and QQQ in the last 5 days. Some will view the two charts underneath and tell you that this is a huge negative divergence, the opposite side will tell you how resilient the indices are and that only price pays, etc…
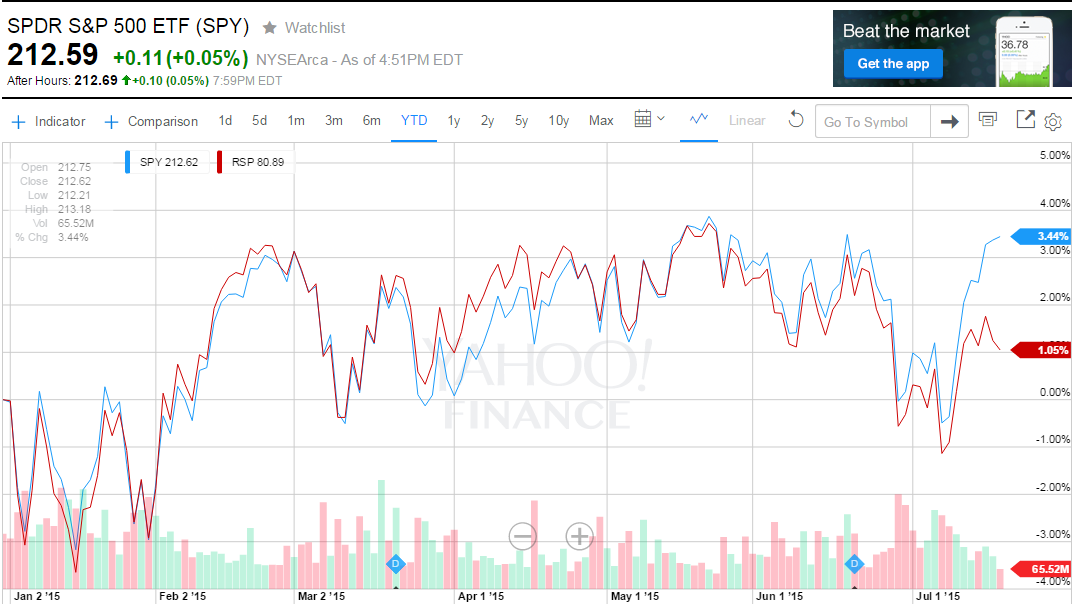
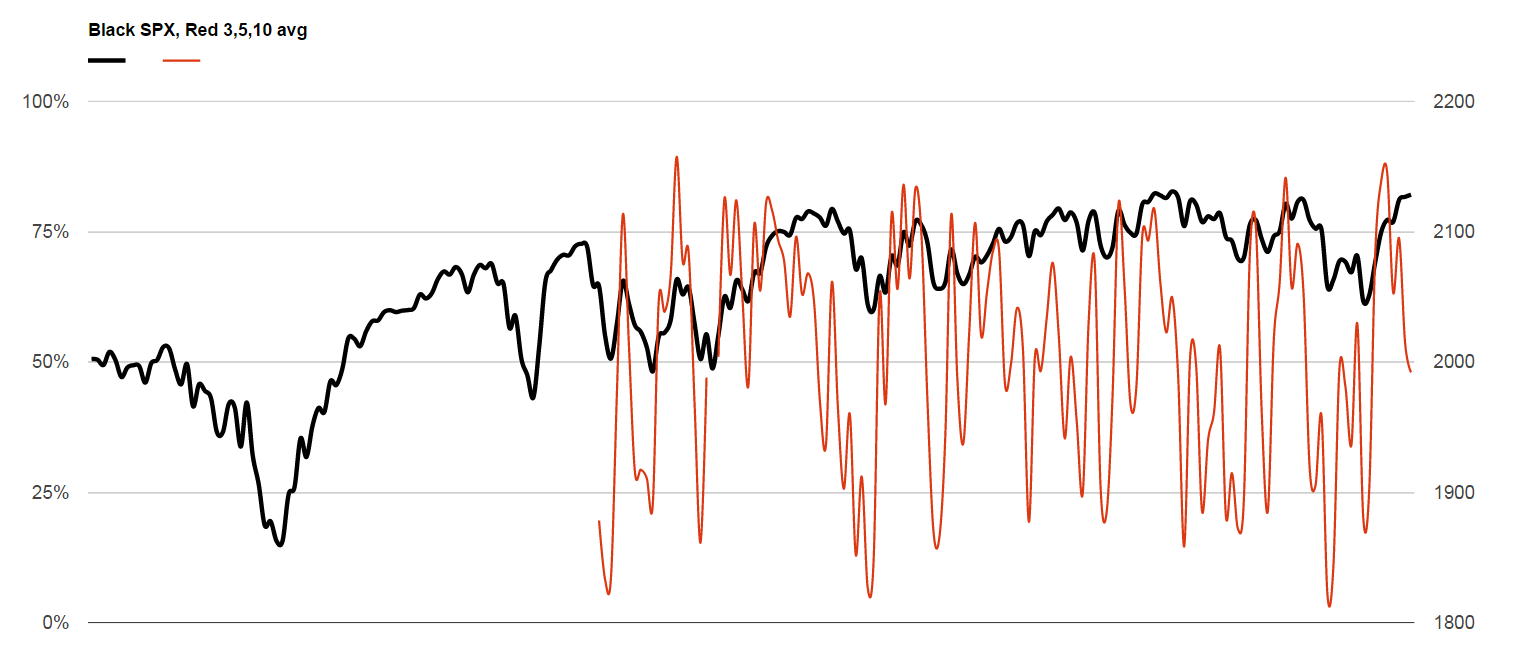
When you take the same stats and compare them to the SP500 the resiliency and divergence is even greater because the SP500 hit an all time high today.
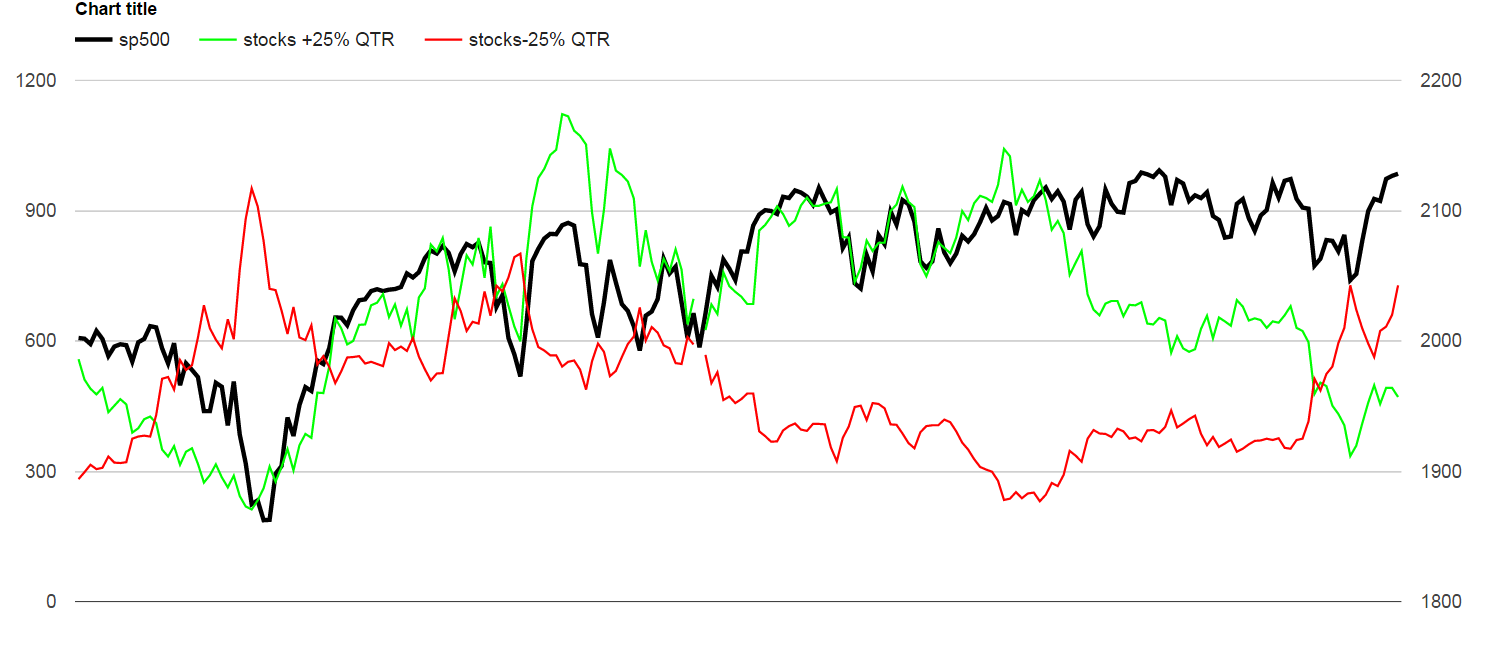
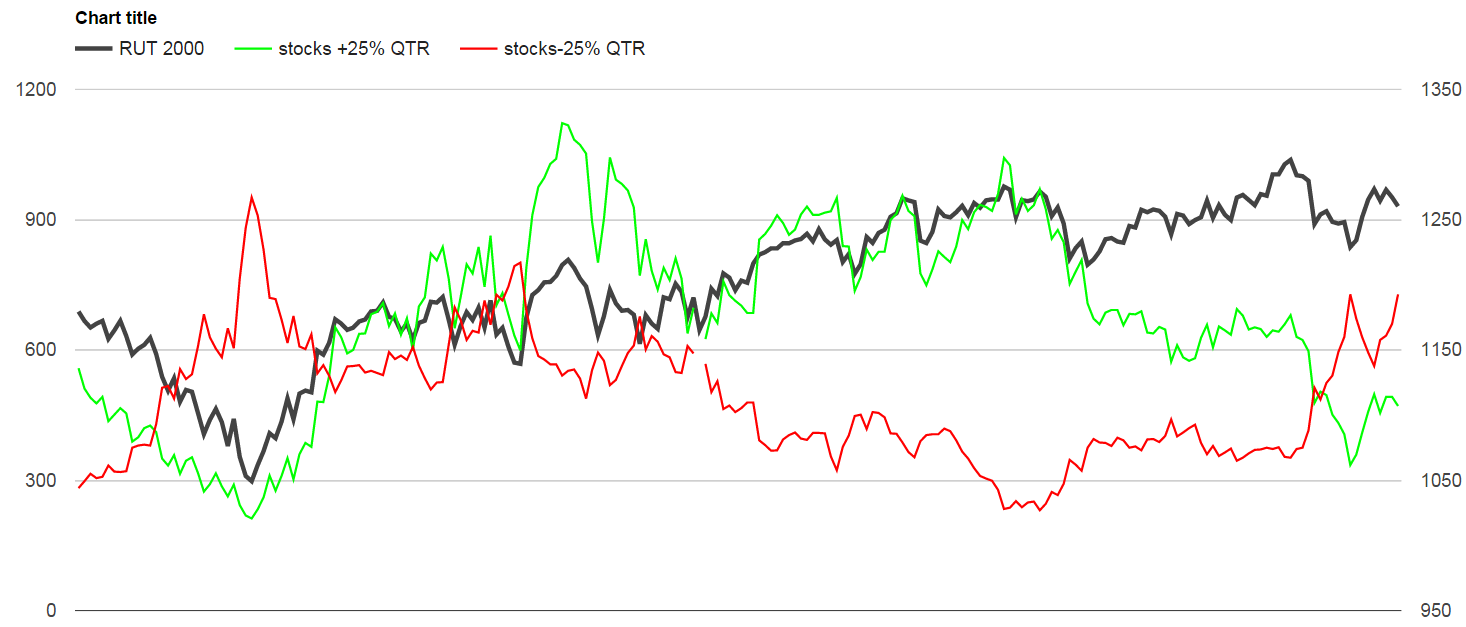
Below you can see both the resiliency and divergence of the SP500 when you compared the average of all SP500 stocks above their 3,5, and 10 day moving average. While the SP500 hit an all time high today the average of all SP500 stocks above their 3,5, and 10 day moving average actually ticked down.


Leave A Comment