
The markets are at all-time highs or a stone’s throw away from all-time highs, but underlying breadth is not what you expect it to be, with indices at highs.
This reminded me of August 2015 when the SP500 was at highs, but most individual names were in the gutter. At the time, the bloggers were pointing out how the SP500 A-D line was at highs, and everything was fine. The traders were complaining about the action, setups after setups were failing, nothing was gaining traction. You can read that post here; https://frankzorrilla.com/the-market-dilemma-that-is-driving-everyone-nuts/.
I’m not going to post a chart about what happened immediately after because I don’t want people to think or assume that just because a certain period in the past had the same stripes as the current period that the outcome has to be the same. You can look at what happened yourself; the post was written on August 19, 2015.
We have a stock market which is the indices, and we have a market of stocks. In my opinion, the market stocks peaked on 2/16/2021.
On the bright side, the market of stocks can right itself by individual names catching up to the indices. Not all negative divergences or bad breadth have to resolve themselves with the indices rolling over. This could very well be a rolling correction where the indices remain untouched.
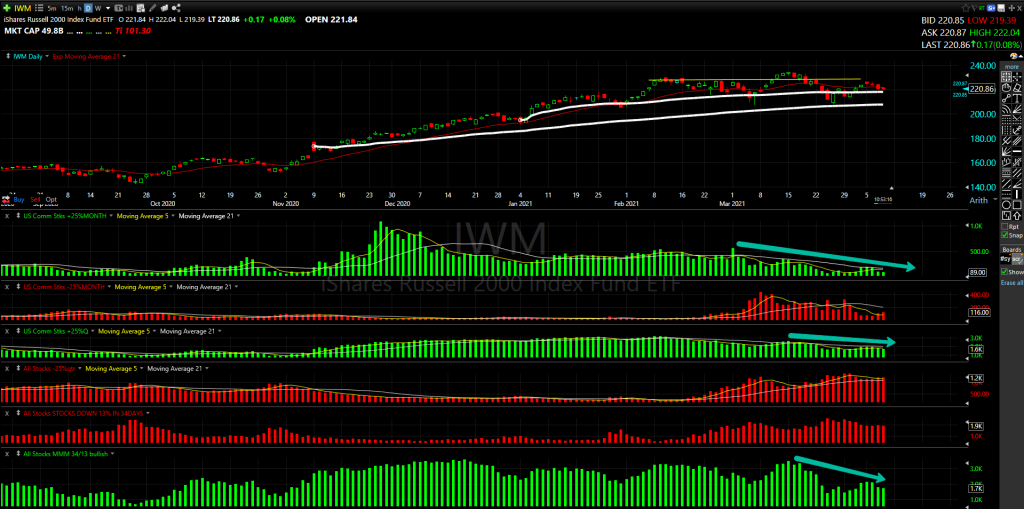
The chart below is self-explanatory; click to enlarge. Swing traders, preserve your mental capital.
You can find Stocks Before They Breakout Here https://bit.ly/2Cuh784 and Here https://bit.ly/2JZ3JNR.
You can view over 400 of my trades here https://www.tradervue.com/shared/users/8059.


Leave A Comment