
Usually, during corrections, I take a look back at previous corrections to see what we can maybe expect, sort of like a roadmap. Many years ago tops used to take the form of an M and bottoms used to look like W. We used to say that M is for murder and W is for winner. Then more recently we started seeing V-bottoms. W-bottoms you get the first low, a bounce then a retest/undercut of the first low, these were very common. Then the V-bottoms came along and instead of retesting lows we were retesting highs and breaking through them within days.
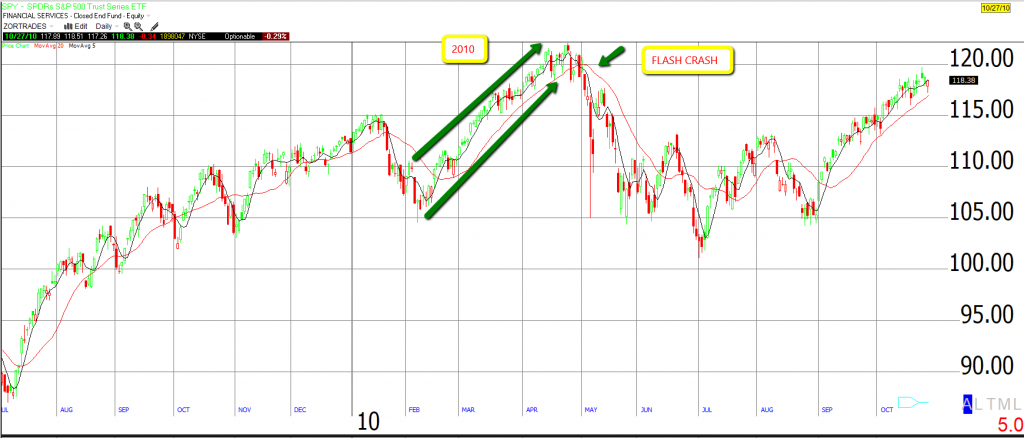
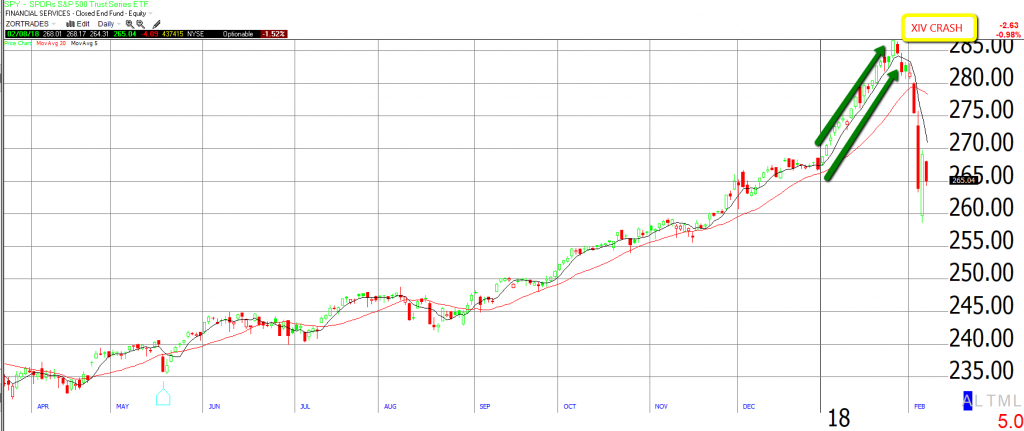
This recent correction reminds me a lot of the flash crash correction. Right before the flash crash the S&P 500 had a mini-melt up, it was up 14% in two and half months, and then it came crumbling down due to an event that had nothing to do with fundamentals. Before this recent correction, one can argue that we witnessed a mini-melt up as well and a little $XIV glitch caused the sell-off. Obviously, the sell-off could’ve been for multiple reasons, but let’s go with $XIV crash as the cause.
Here are the two charts that could make for some interesting watercooler talk.
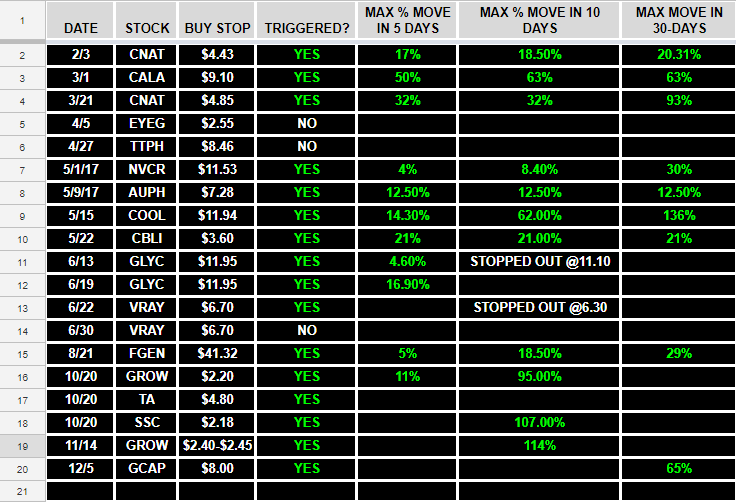
STOCK OF THE WEEK RECAP
Frank Zorrilla, Registered Advisor In New York. If you need a second opinion, suggestions, and or feedback in regards to the market feel free to reach me at fzorrilla@zorcapital.com or 646-480-7463.
See How I Translate My Tweets & Blogs Into Actual 3rd Party Verified Trades


Leave A Comment