When your scans are based on the way stocks actually move, then you can use the same EXACT scans on different timeframes; intraday, daily, weekly.
You might be asking yourself, how do stocks move?
Go through hundreds of charts and start to pinpoint where moves are starting from?
Take a look at these examples;
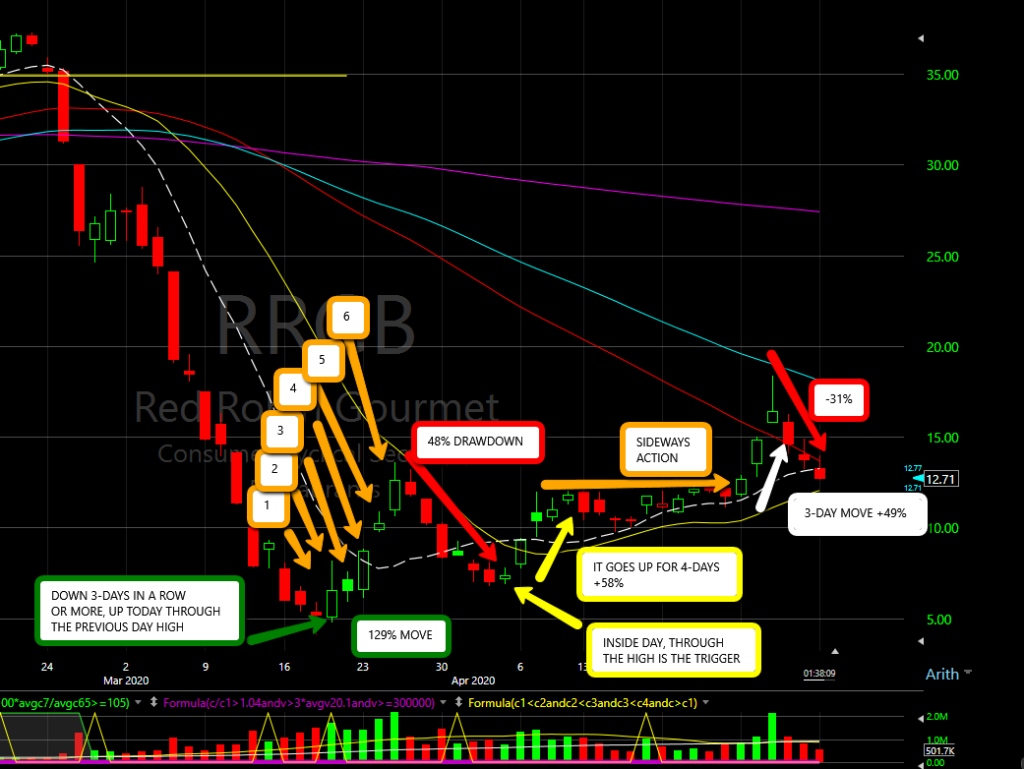
You have to get out of your head the thought that moves only start when they break a resistance level; that’s nonsense.
So after you go through hundreds of charts and pinpoint starting points of moves, you can begin to write your own scans.
One of my favorite scans is a mean reversion scan that I use on an intraday, daily, and weekly timeframe. The set-up and management of the trades are the same on all of the timeframes.
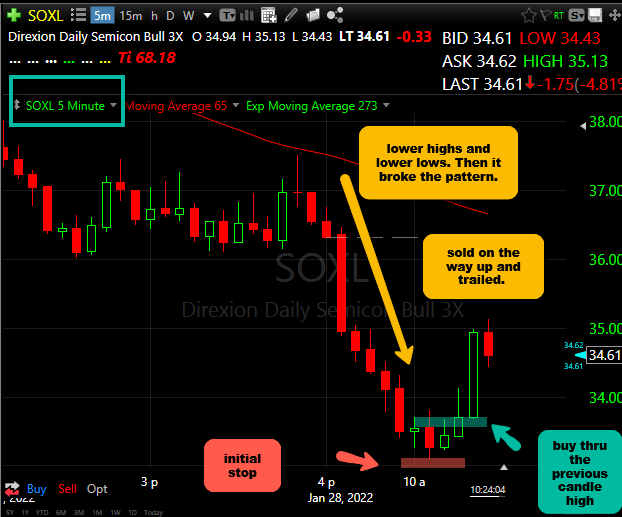
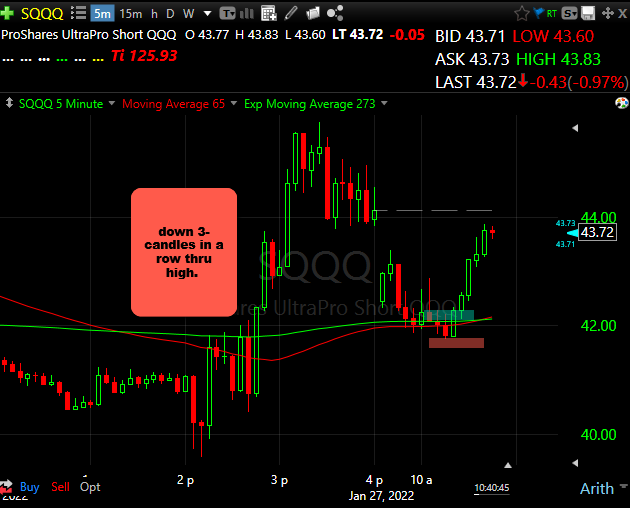
Here are some recent examples;
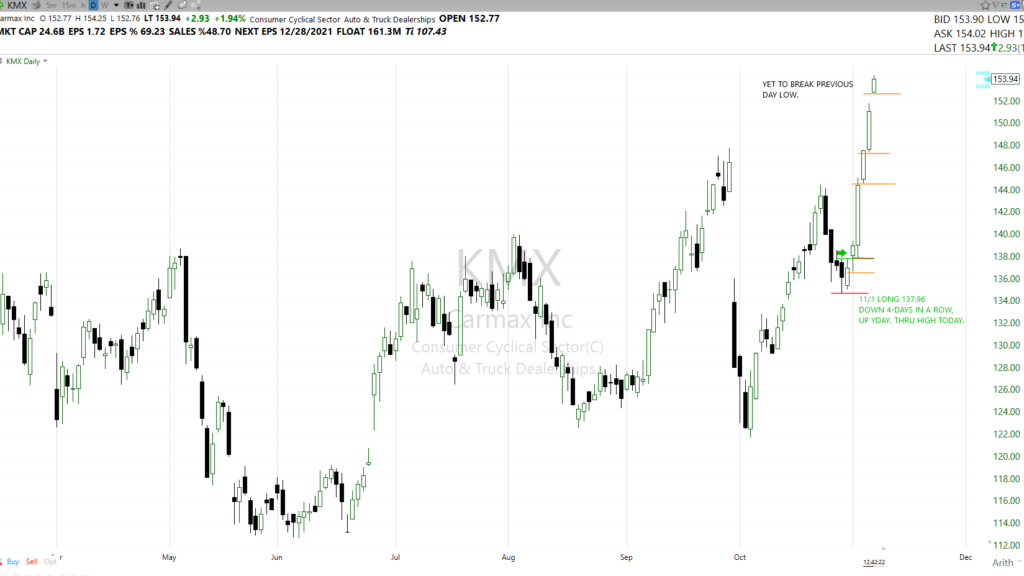
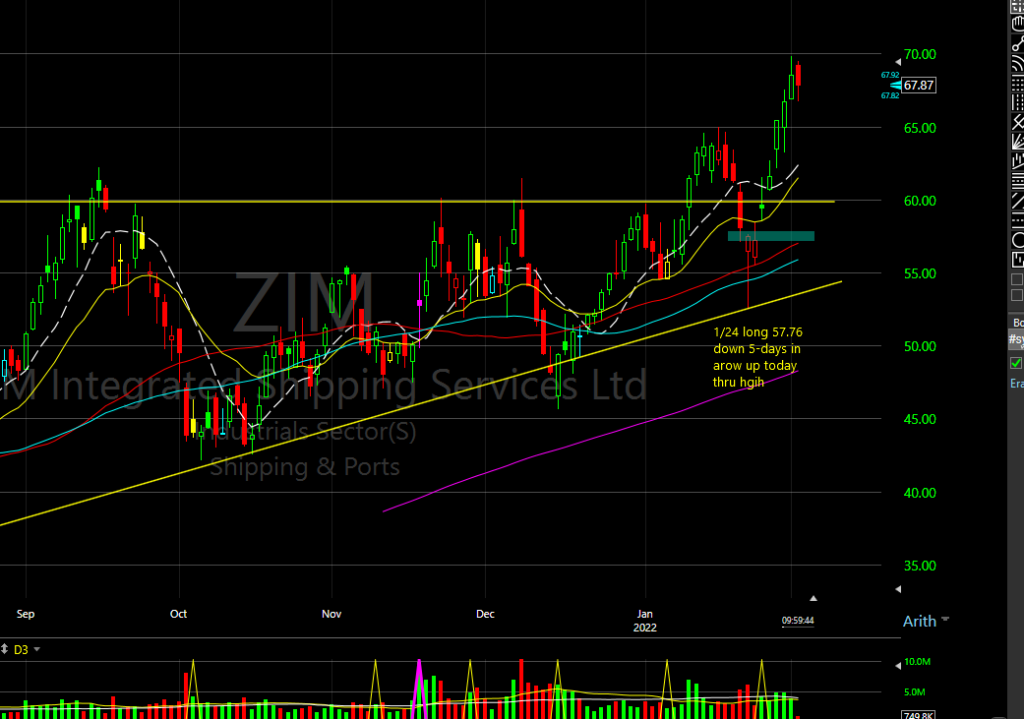
Here is a recent example on the daily timeframe;

Stay connected;
You can find Stocks Before They Breakout Here and here
You can view over 400 of my trades here https://www.tradervue.com/shared/users/8059.