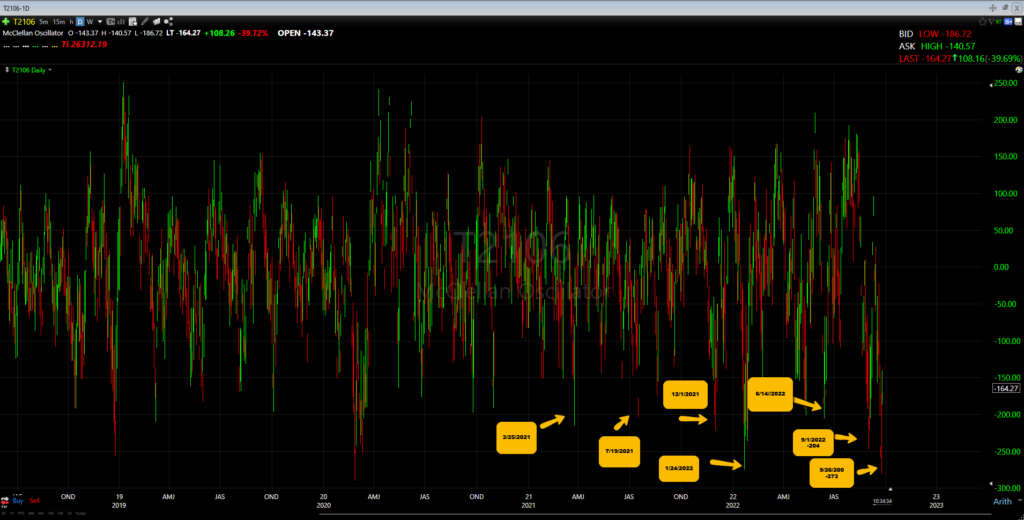
Based on the indicator T2106, the McClellan Oscillator, the market is more oversold than it has been in a while. 

Readings of -200 are considered oversold, and they rarely happen. Yesterday we clocked a reading of -273.

The chart below shows the recent dates where we had -200+ readings on the McClellan Oscillator.

Here is the SPY chart when annotated with the dates above.

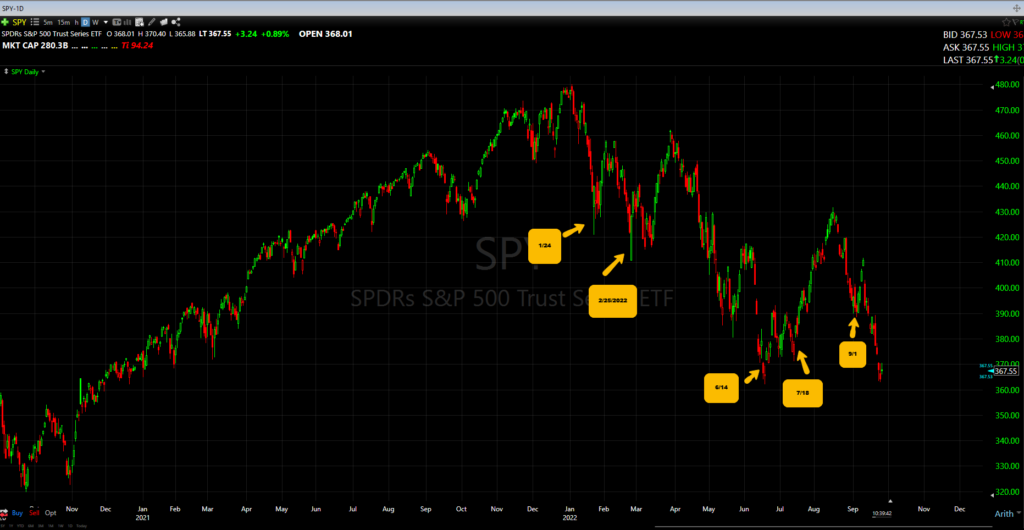
We have all heard the saying; oversold can become more oversold. That is true, but we are in a game of probabilities. And the probabilities favor a short-term bounce before new lows are made. 

We take this information and make it actionable with specific ETFs and specific entry and exit levels. You can check it out here;

This information is issued solely for informational and educational purposes and does not constitute an offer to sell or a solicitation of an offer to buy securities. None of the information contained in this blog constitutes a recommendation that any particular security, portfolio of securities, transaction, or investment strategy is suitable for any specific person. From time to time, the content creator or its affiliates may hold positions or other interests in securities mentioned in this blog. The stocks presented are not to be considered a recommendation to buy any stock. This material does not take into account your particular investment objectives. Investors should consult their own financial or investment adviser before trading or acting upon any information provided. Past performance is not indicative of future results.