
The S&P500 is down -7.82% for the month of December as of yesterday’s close (12/16/2017.
The S&P500 is down -13.43% from its 52-week high that it reached on 9/21/2018.
And its down -4.78% year to date.
The small-cap index has faired a lot worse. The Russell 2000 is down -10% this month, down -21% from its 52-week high that was reached on 8/31/2018 and down -10% year to date.
So far this all normal, according to Ryan Detrick the range in the S&P500 this year is 14.4% (Max year to date gain was 9.6%, minimum year to date loss is -4.8%). The average range since 1950 is little over 23%.
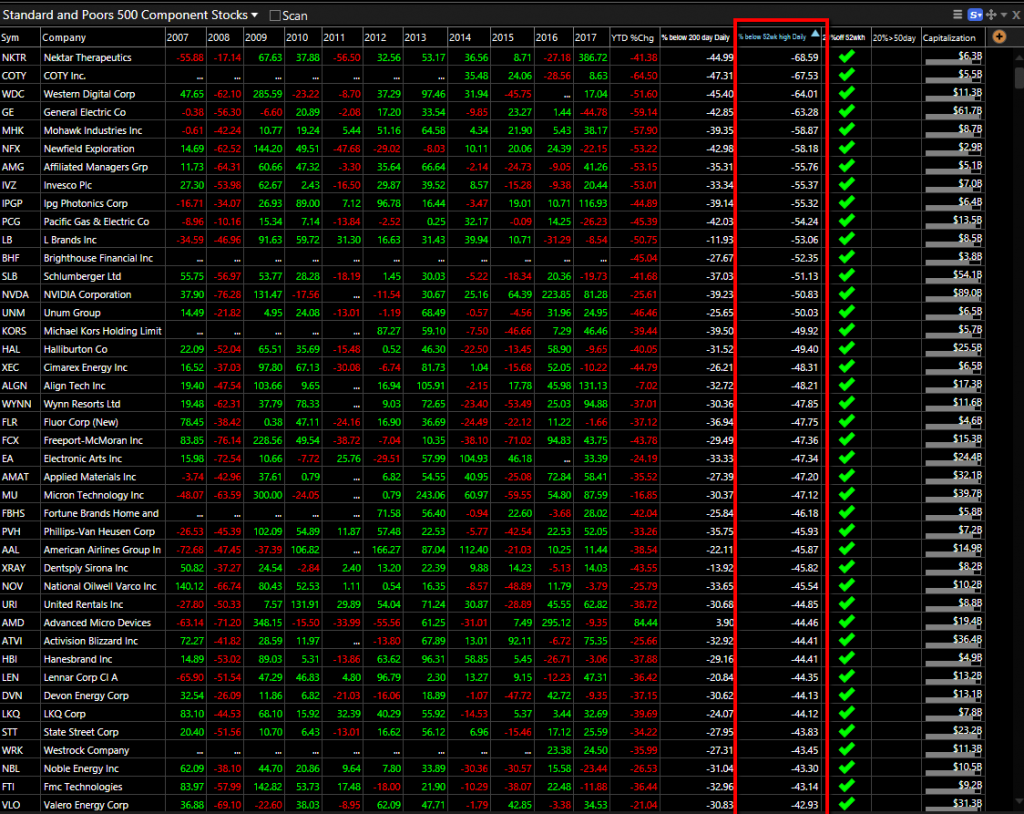
Like always, individual stocks are doing a lot worse than the indices; 55% of the S&P500 names are down -20% or more from their 52-week high.
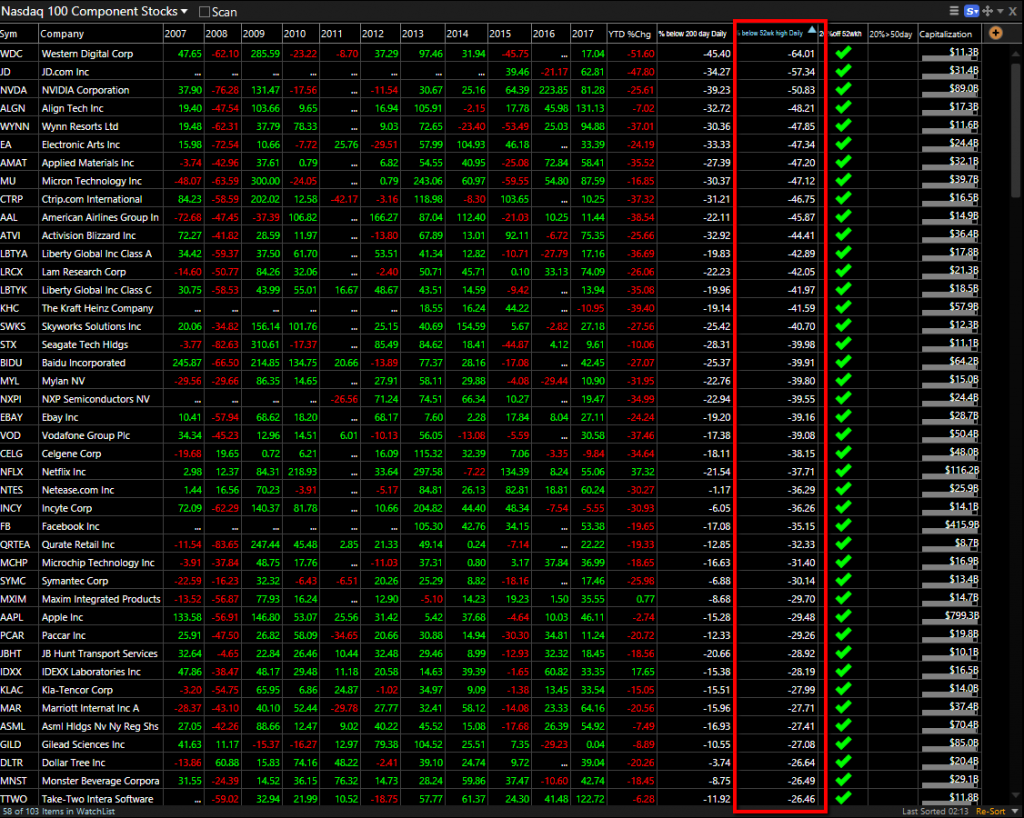
58% of $QQQ names are down -20% or more from their 52week high.
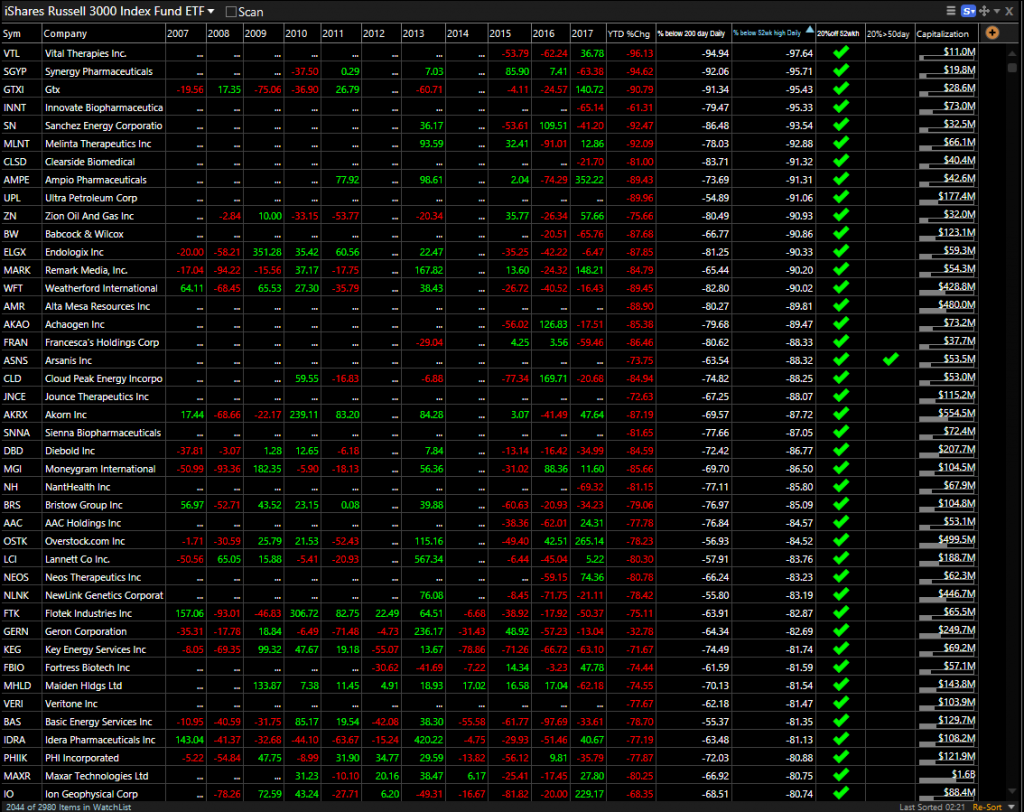
In the Russell 3000, $IWV which many call the “investable universe” 2,044 names out of 2,980 are down -20% or more from their 52-week high, 68%.
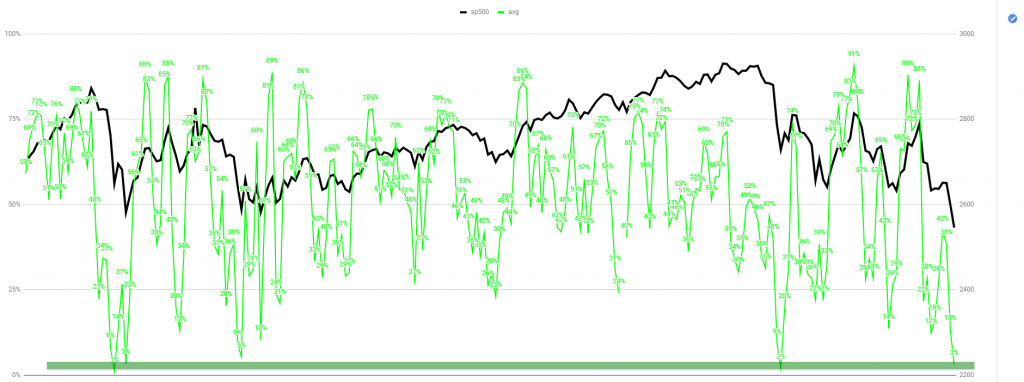
Yesterday we had near washout breadth levels; figures were so bad that the chances are high that they might turn out to be a short-term positive for the market.
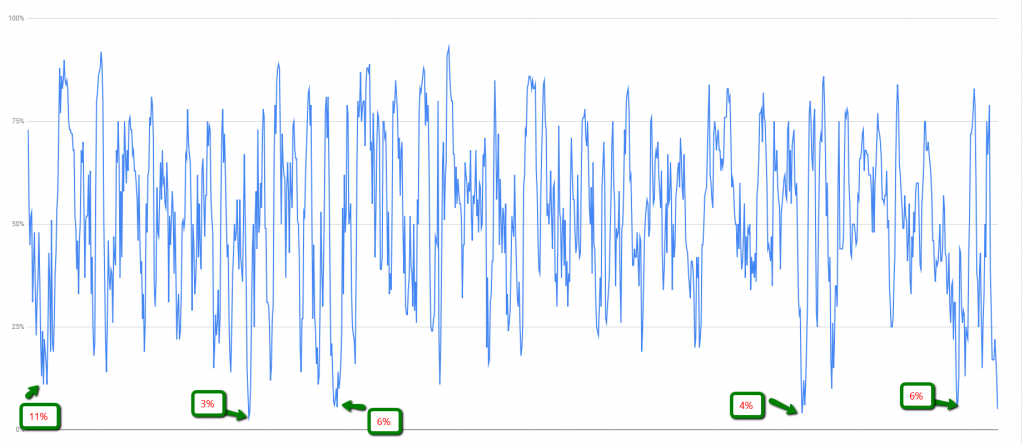
Only 3% of S&P500 stocks closed above their 3,5, and 10-day moving averages, you can see clearly on the chart below what has happened after we get such washout readings.
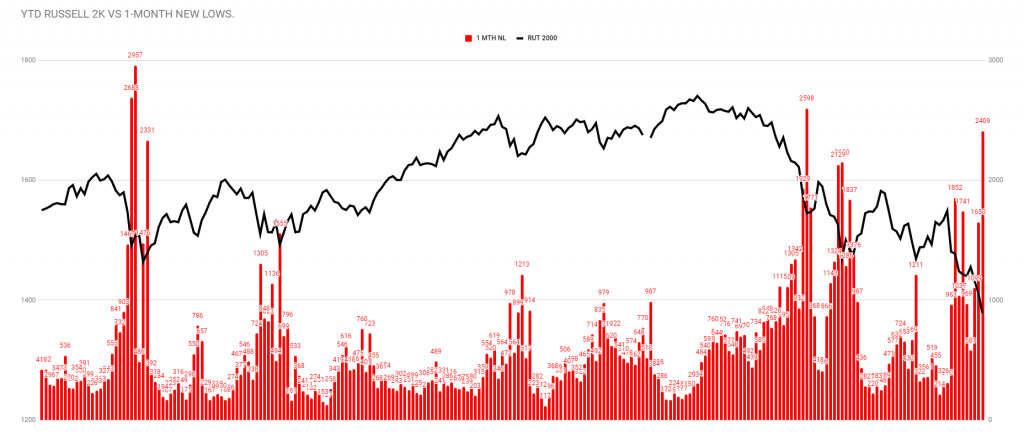
2,409 hit fresh 1-month lows; spikes in fresh 1-month lows is usually a short-term positive.
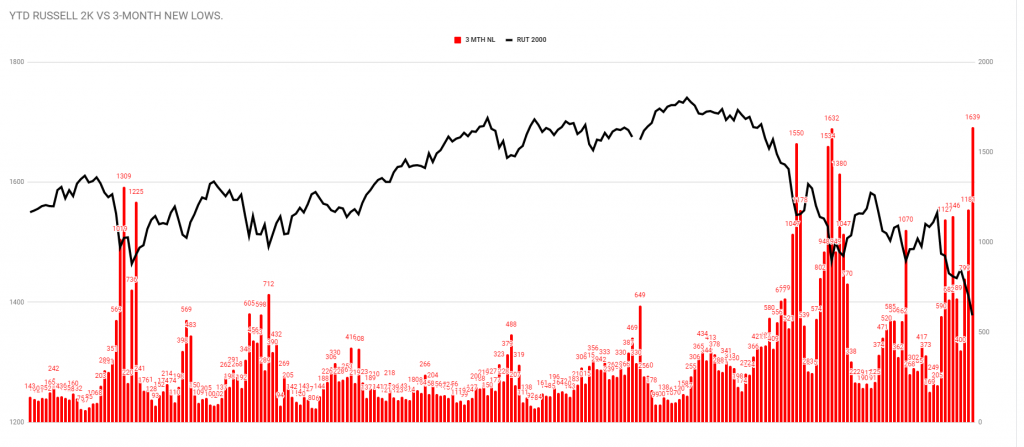
1,609 stocks hit 3-month lows;
Only 5% of the Russell 3,000 stocks closed above their 10-day moving average.
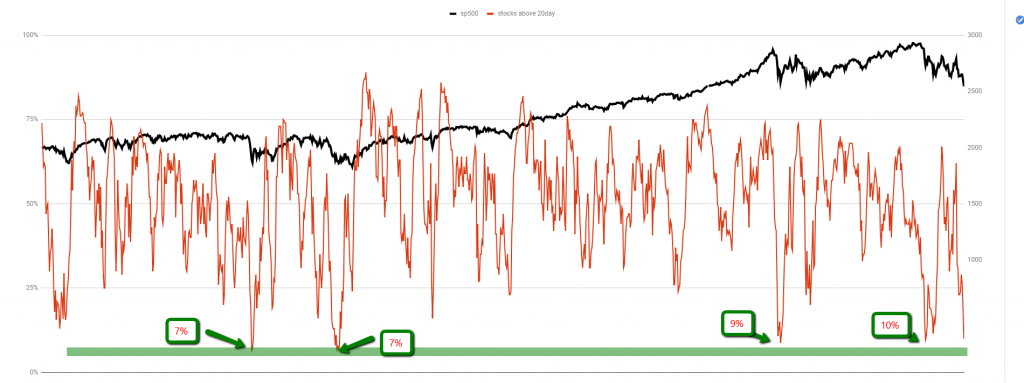
Only 10% of all stocks are above their 20-day moving average.
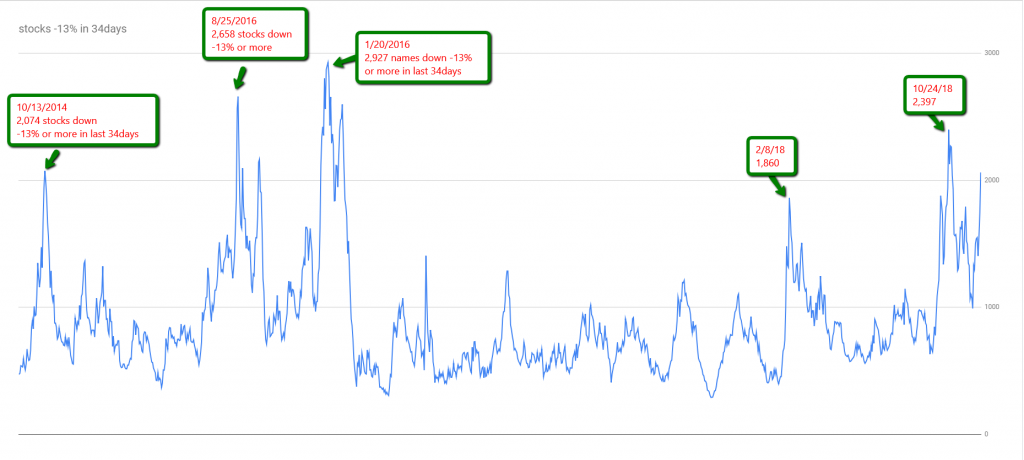
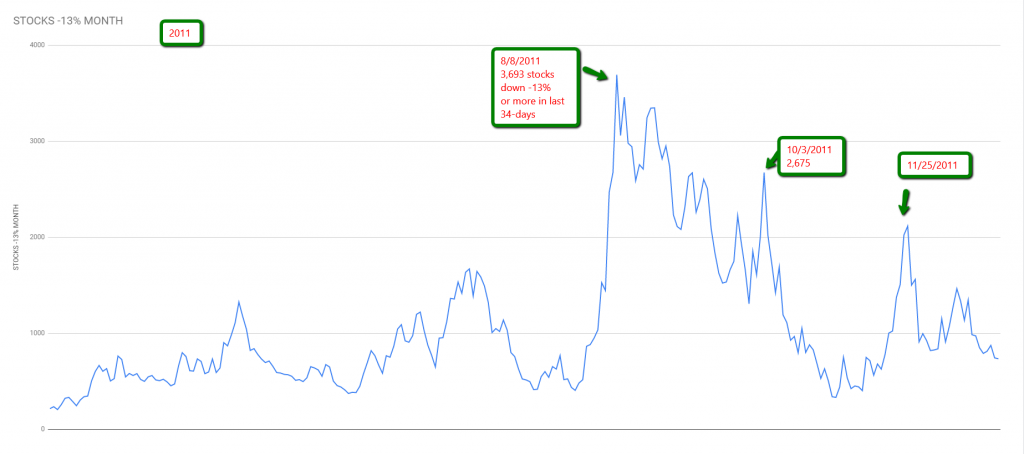
2,061 names down 13% or more in the last 34-days, spikes are good for short-term bounces.
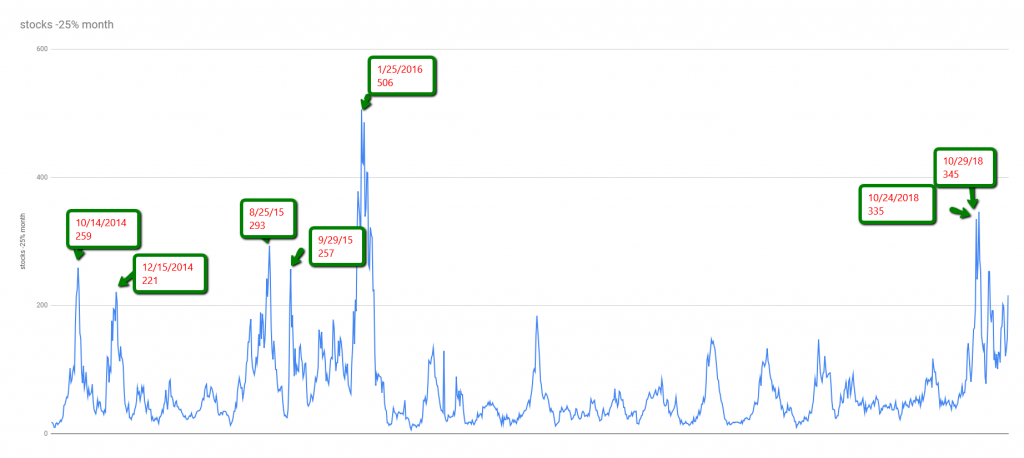
216 stocks are down 25% or more in the last month.
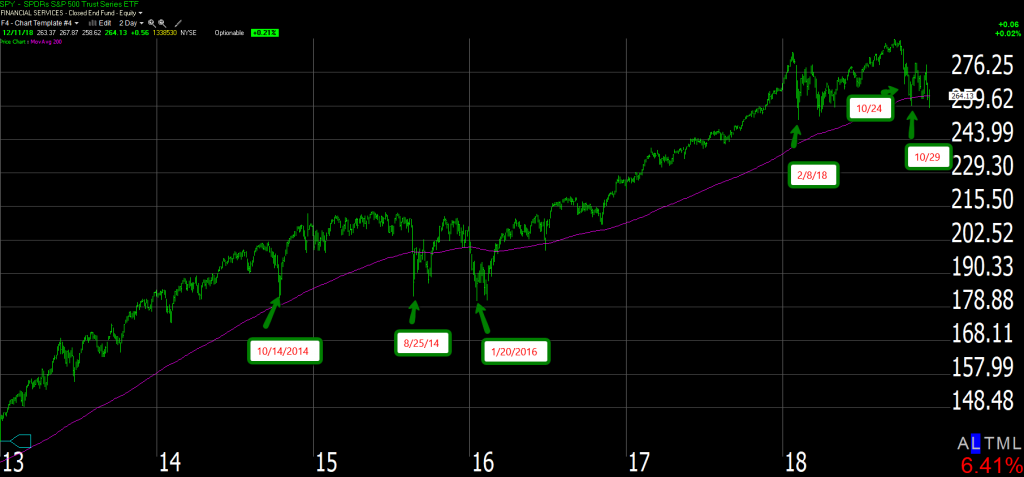
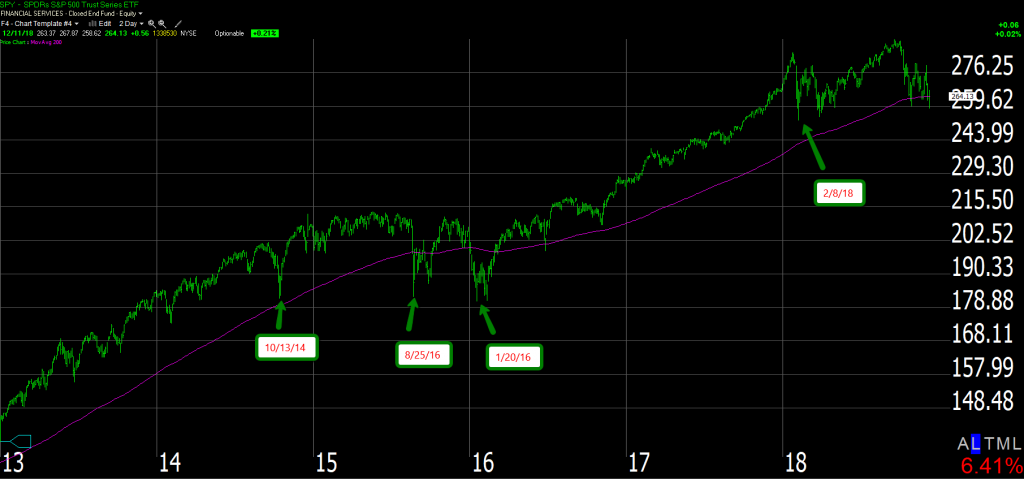
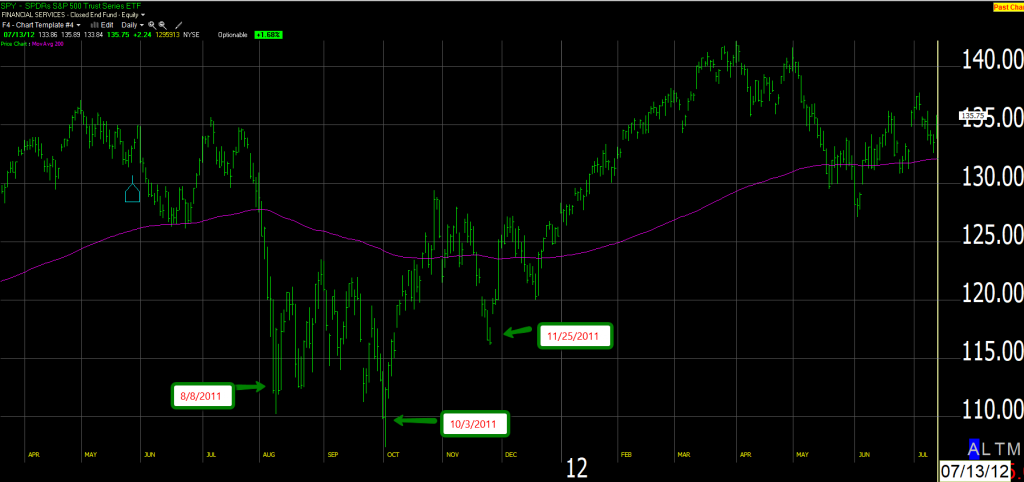
If you remember, 2011 was rough for the bulls, just like now the market took a nose dive, here are some charts to put today in context;
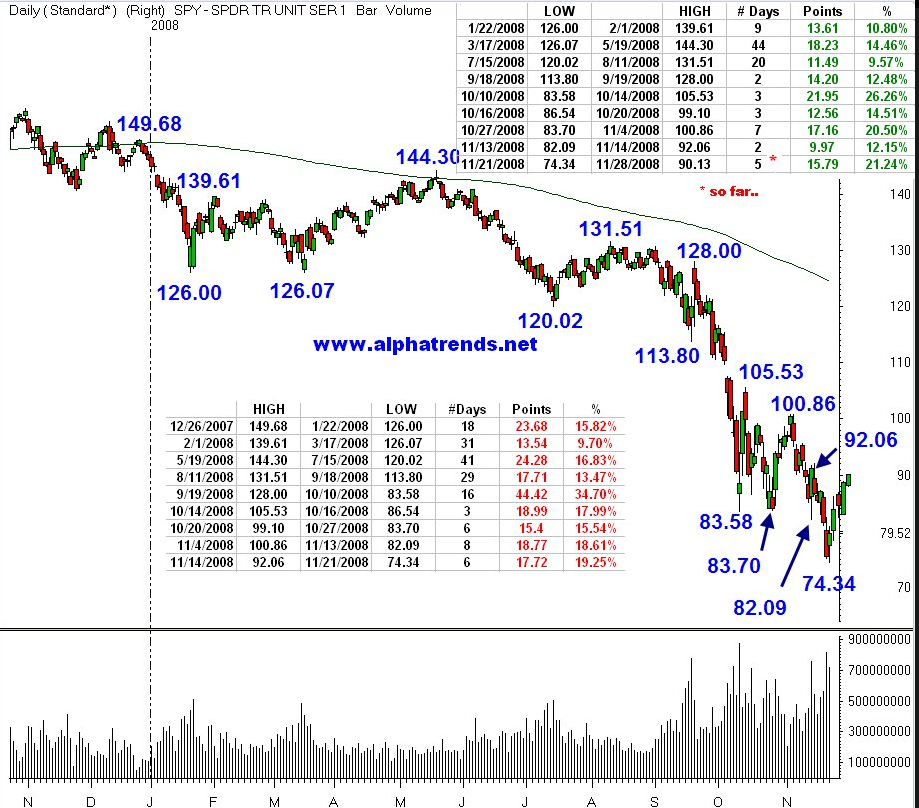
When we get these nasty sell-offs, people tend to forget that the market goes up and down not up or down, it really does not matter what is going on, selling short into a snap-back is much better than shorting in the hole thinking that a low probability event will happen (crash). In 2008, during the Great Financial Crisis, the market had some vicious sell-offs and rallies; 3 snapback rallies were greater than 20%, five were in the 10-20% range. Chart by @AlphaTrends.
My suggestions are always the same;
- Don’t short in the hole.
- Don’t forget that the market goes up and down not up or down.
- Use the snapback rallies to trim if you think that we are going lower.
- Don’t marry stocks; trades are trades, don’t make a trade into an investment just because you don’t want to take a loss.
- The indices tend to move higher over time; individual stocks are a different story, many don’t come back, take your loss and live to fight another day.


Leave A Comment