
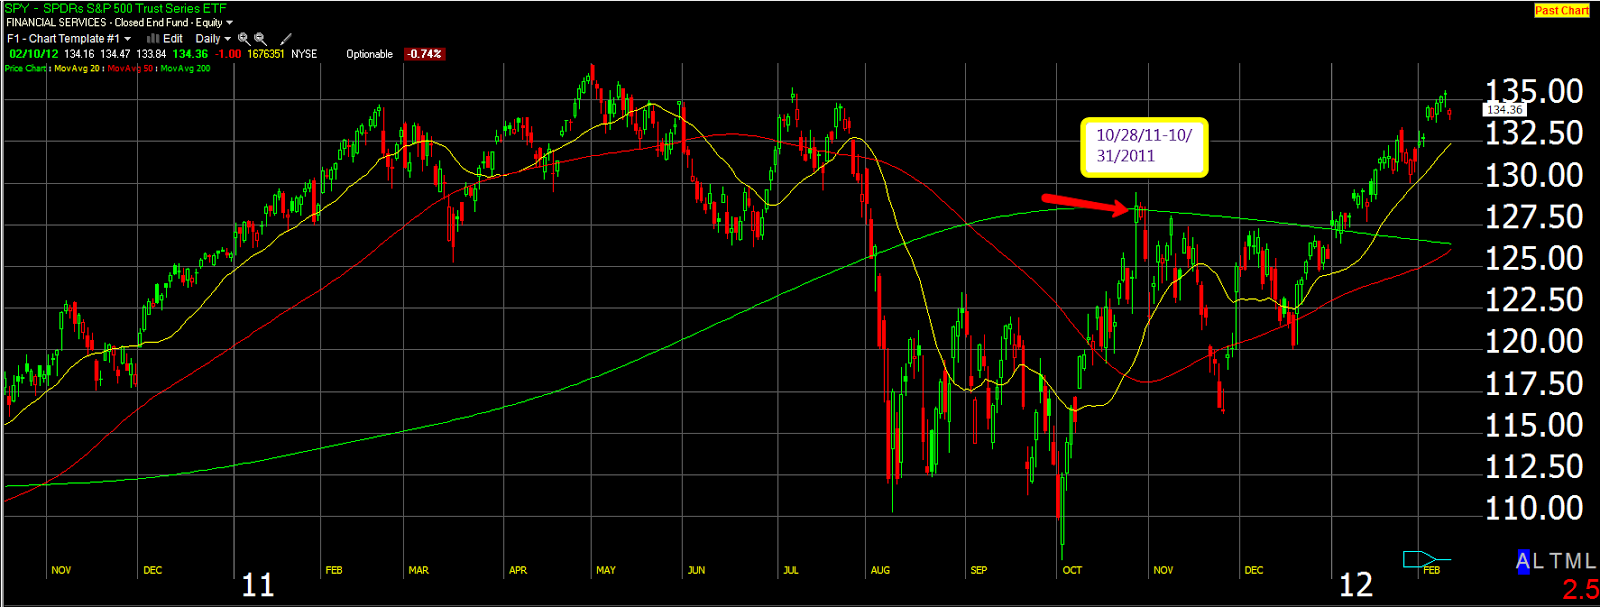
You don’t have to be a Chartered Market Technician to see that we are looking at some potential–possible overhead resistance. Seeing where we’ve come from in such a short period ($182ish-202.76), one can understand why a short-term speculator probably wouldn’t push the envelope here.

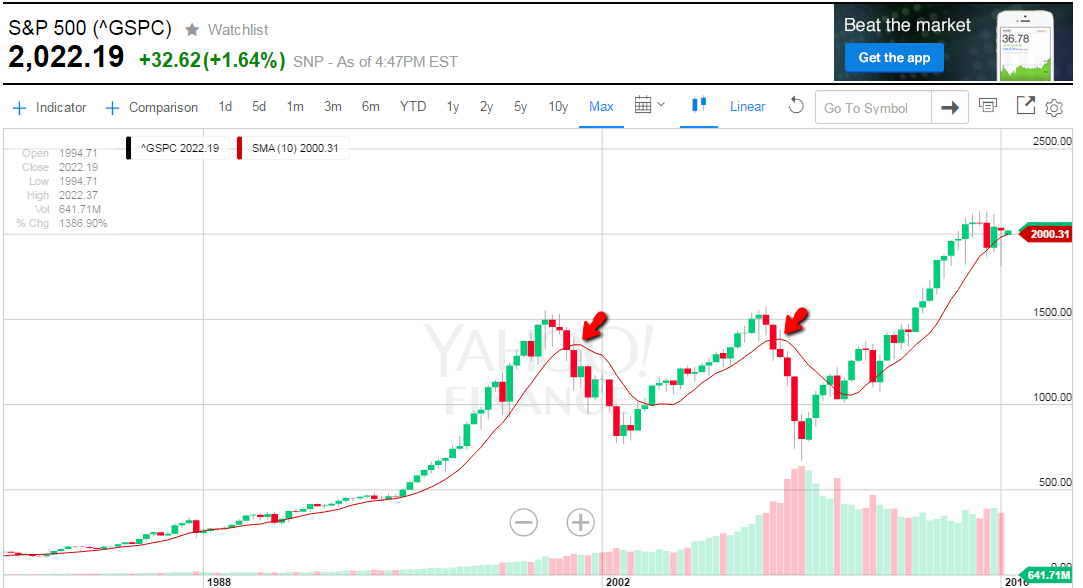
The SP500 closed above its 200-day moving average on Friday for the first time this year. The most widely accepted definition of whether or not the market is in a bull phase or bear phase is whether or not it is trading above or below the 200-day moving average. Some trend followers use the 10-month moving average as a tactical way to be in or out of the market. So while we are above the 10-month for now, the month is not over yet, and monthly close is what is needed to confirm the “bull phase.”
This week is and will be a big week; options expiration, FOMC Statement, interest rate decision, Fed Chair Yellen speaks, and BOJ meeting.
March options expiration weeks have been very positive for the market, out the last 31, 21 have been positive and very profitable as you can see in the chart below. H/t Rob Hanna.
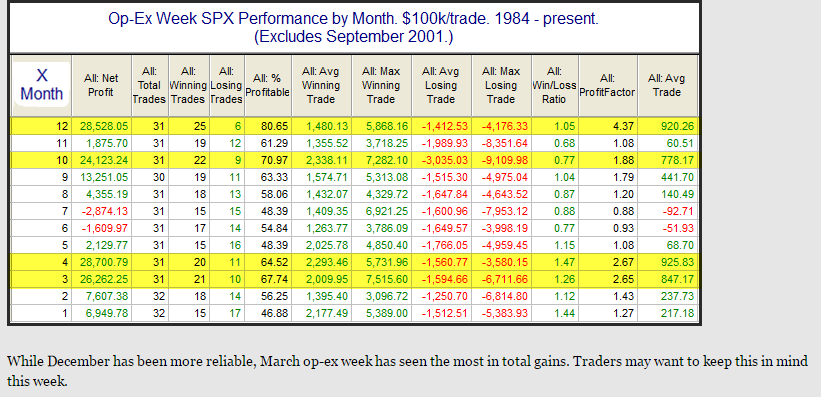
When both Options Expiration and FOMC meeting fall in the same week, the market has done extremely well. This has happened 31 times in which 23 (74%) have resulted in winning weeks for the SPY with an average change of +1.17%. When the FOMC has landed a non-OPEX week the stats are negative; 41 winners, 55 losers, average change -0.10%.
Given the above stats, one can assume that a long-biased trader probably has a green light until Friday, but given where we have come from I would not be pushing my luck in the short-term. SOURCE; PASTSTAT
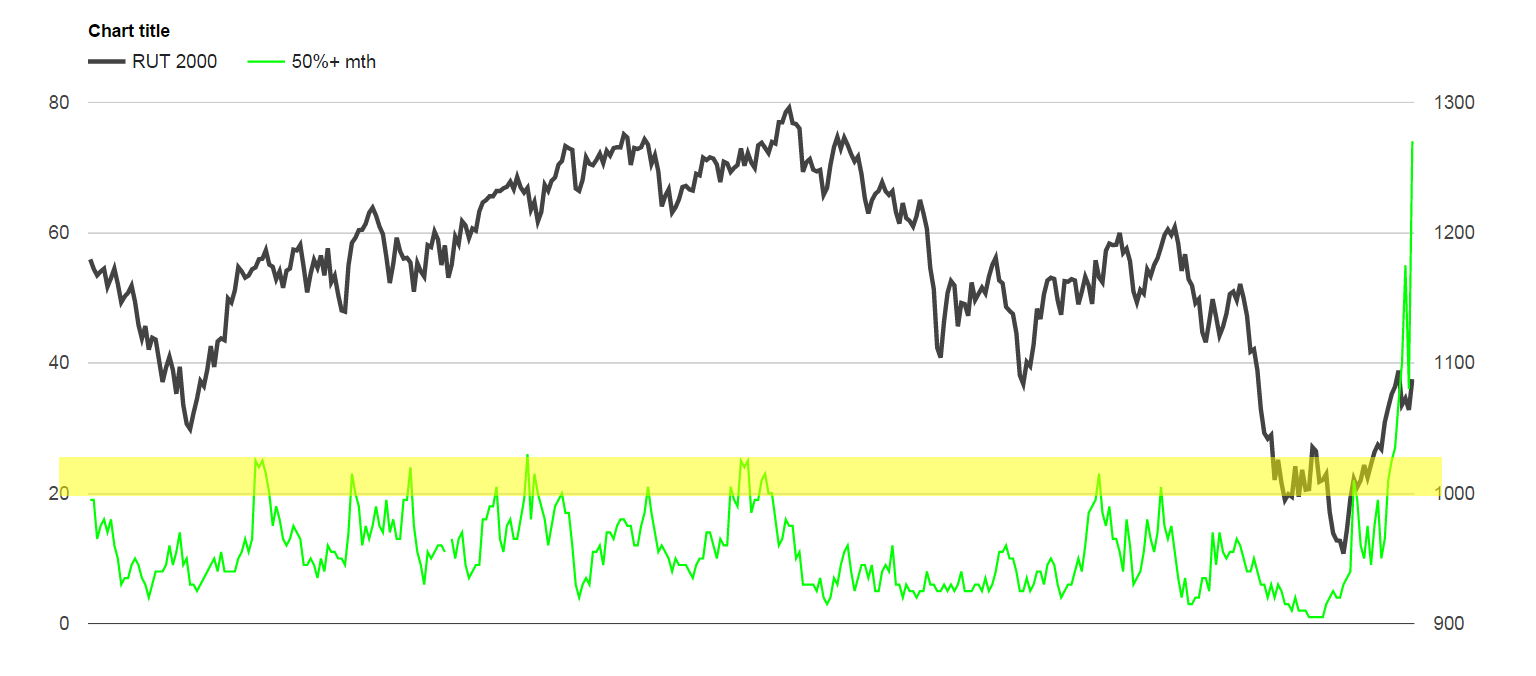
Over the last two weeks, we have been blessed with another V-bottom (sarcasm). Unlike the previous V-bottoms this one has had phenomenal breadth, and the reason is that the Russell 2000 has participated and has been the top performer. Sure, the beaten up names coming from 52-week lows are the one’s being picked up and leading, but not all rallies are or should be the same, adapt. Right around now, 21 days into this V-rally is when many start believing that we are never going to have a downtick again. The October 2015 V-bottom lasted 26 trading days, the V-bottom from October 2015 lasted about 26 days as well. The current V-rally is being compared to those two.

Because the Russell 2000 is finally participating the breadth of the market has been surprisingly good, the best I can remember in a long time. It has been so good that it is now a short-term negative. We currently have 74 stocks up 50% or more in the last month, historically readings in the 20’s are considered red-hot and generally lead to a pullback.


Leave A Comment