
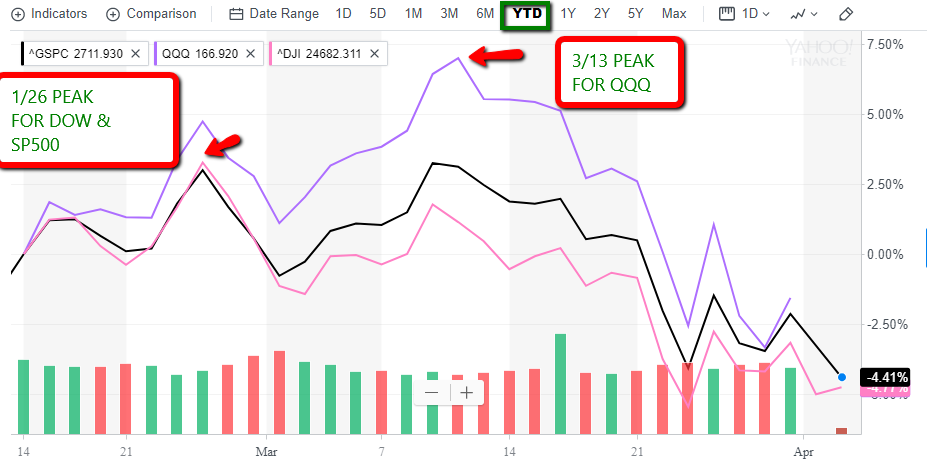
It’s no secret that the market has been under pressure. The year to date drawdown on the indices are not horrible, -3.5% for the S&P500, -4% for the Dow Jones and less than -1% for the Nasdaq 100. However, the drawdown from the January 26 high is a lot more significant, -11% for the Dow Jones, -10% for the S&P500 and -12% for the Nasdaq 100 from its 3/13/18 peak.
For those that don’t own the indices as core holdings, now might be a good time to own some since these type of drawdowns are a common practice as you can see below.

Very simply, since 1980 the average intra-year decline in the S&P 500 is 13.8%, despite that drawdown the S&P 500 has managed to close higher 29 out of 38 years (76%).
Even if you are a hardcore swing trader, I still believe that owning the indices as core positions make a ton of sense when we get down near the average intra-year drawdown.
Getting back to stocks, a majority of stocks have higher betas than the indices, so many are down a lot more from their peaks than the indices. If and when the market bounces there’s no guarantee that they will bounce with the market or even regain their previous luster. Typically after corrections, new leaders emerge, and the old leaders take a back seat.
Here’s an easy free way to narrow down the universe of stocks to potentially find new leaders. It’s a simple performance ranked scan. If you believe that the stocks that held up the best during the correction are the ones that will do better once the market resumes its uptrend here’s what you do.
- Go to finviz.com
- Click on screener.
- Use these presets;
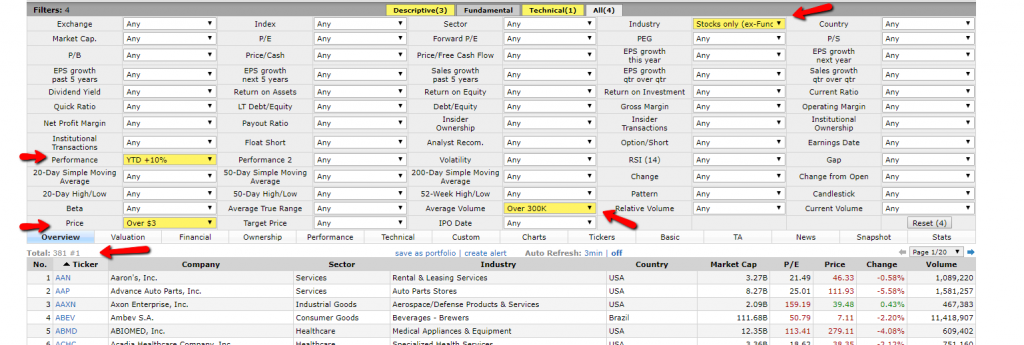
4. As of today that will narrow down your universe down to 381 names (SCREENER).
You can refresh this list every day, you can also add additional filters based on some of the things you believe in; above the 50-day ma, positive eps, volume, price, etc.
I’m opening my managed assets program if you have an interest or need a second opinion feel free to REACH OUT.
Frank Zorrilla, Registered Advisor In New York. If you need a second opinion, suggestions, and or feedback in regards to the market feel free to reach me at fzorrilla@zorcapital.com or 646-480-7463.
See How I Translate My Tweets & Blogs Into Actual 3rd Party Verified Trades


Leave A Comment